RBS 2010 Annual Report Download - page 138
Download and view the complete annual report
Please find page 138 of the 2010 RBS annual report below. You can navigate through the pages in the report by either clicking on the pages listed below, or by using the keyword search tool below to find specific information within the annual report.-
 1
1 -
2
-
3
-
4
-
5
-
6
-
7
-
8
-
9
-
10
-
11
-
12
-
13
-
14
-
15
-
16
-
17
-
18
-
19
-
20
-
21
-
22
-
23
-
24
-
25
-
26
-
27
-
28
-
29
-
30
-
31
-
32
-
33
-
34
-
35
-
36
-
37
-
38
-
39
-
40
-
41
-
42
-
43
-
44
-
45
-
46
-
47
-
48
-
49
-
50
-
51
-
52
-
53
-
54
-
55
-
56
-
57
-
58
-
59
-
60
-
61
-
62
-
63
-
64
-
65
-
66
-
67
-
68
-
69
-
70
-
71
-
72
-
73
-
74
-
75
-
76
-
77
-
78
-
79
-
80
-
81
-
82
-
83
-
84
-
85
-
86
-
87
-
88
-
89
-
90
-
91
-
92
-
93
-
94
-
95
-
96
-
97
-
98
-
99
-
100
-
101
-
102
-
103
-
104
-
105
-
106
-
107
-
108
-
109
-
110
-
111
-
112
-
113
-
114
-
115
-
116
-
117
-
118
-
119
-
120
-
121
-
122
-
123
-
124
-
125
-
126
-
127
-
 128
128 -
 129
129 -
 130
130 -
 131
131 -
 132
132 -
 133
133 -
 134
134 -
 135
135 -
 136
136 -
 137
137 -
 138
138 -
 139
139 -
 140
140 -
 141
141 -
 142
142 -
 143
143 -
 144
144 -
 145
145 -
 146
146 -
 147
147 -
 148
148 -
149
-
150
-
151
-
152
-
153
-
154
-
155
-
156
-
157
-
158
-
159
-
160
-
161
-
162
-
163
-
164
-
165
-
166
-
167
-
168
-
169
-
170
-
171
-
172
-
173
-
174
-
175
-
176
-
177
-
178
-
179
-
180
-
181
-
182
-
183
-
184
-
185
-
186
-
187
-
188
-
189
-
190
-
191
-
192
-
193
-
194
-
195
-
196
-
197
-
198
-
199
-
200
-
201
-
202
-
203
-
204
-
205
-
206
-
207
-
208
-
209
-
210
-
211
-
212
-
213
-
214
-
215
-
216
-
217
-
218
-
219
-
220
-
221
-
222
-
223
-
224
-
225
-
226
-
227
-
228
-
229
-
230
-
231
-
232
-
233
-
234
-
235
-
236
-
237
-
238
-
239
-
240
-
241
-
242
-
243
-
244
-
245
-
246
-
247
-
248
-
249
-
250
-
251
-
252
-
253
-
254
-
255
-
256
-
257
-
258
-
259
-
260
-
261
-
262
-
263
-
264
-
265
-
266
-
267
-
268
-
269
-
270
-
271
-
272
-
273
-
274
-
275
-
276
-
277
-
278
-
279
-
280
-
281
-
282
-
283
-
284
-
285
-
286
-
287
-
288
-
289
-
290
-
291
-
292
-
293
-
294
-
295
-
296
-
297
-
298
-
299
-
300
-
301
-
302
-
303
-
304
-
305
-
306
-
307
-
308
-
309
-
310
-
311
-
312
-
313
-
314
-
315
-
316
-
317
-
318
-
319
-
320
-
321
-
322
-
323
-
324
-
325
-
326
-
327
-
328
-
329
-
330
-
331
-
332
-
333
-
334
-
335
-
336
-
337
-
338
-
339
-
340
-
341
-
342
-
343
-
344
-
345
-
346
-
347
-
348
-
349
-
350
-
351
-
352
-
353
-
354
-
355
-
356
-
357
-
358
-
359
-
360
-
361
-
362
-
363
-
364
-
365
-
366
-
367
-
368
-
369
-
370
-
371
-
372
-
373
-
374
-
375
-
376
-
377
-
378
-
379
-
380
-
381
-
382
-
383
-
384
-
385
-
386
-
387
-
388
-
389
-
390
-
391
-
392
-
393
-
394
-
395
-
396
-
397
-
398
-
399
-
400
-
401
-
402
-
403
-
404
-
405
-
406
-
407
-
408
-
409
-
410
-
411
-
412
-
413
-
414
-
415
-
416
-
417
-
418
-
419
-
420
-
421
-
422
-
423
-
424
-
425
-
426
-
427
-
428
-
429
-
430
-
431
-
432
-
433
-
434
-
435
-
436
-
437
-
438
-
439
-
440
-
441
-
442
-
443
-
444
-
445
 |
 |

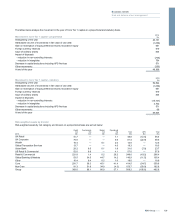
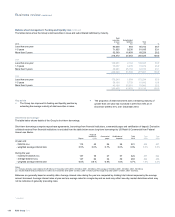
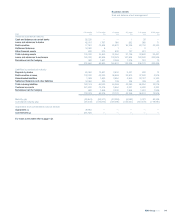
Balance sheet management: Funding and liquidity risk continued
The tables below show the Group’s debt securities in issue and subordinated liabilities by maturity.
Debt
securities
in issue
Subordinated
liabilities Total
2010 £m £m £m %
Less than one year 94,048 964 95,012 38.7
1-5 years 71,955 9,230 81,185 33.1
More than 5 years 52,369 16,859 69,228 28.2
218,372 27,053 245,425 100.0
2009
Less than one year 136,901 2,144 139,045 50.0
1-5 years 70,437 4,235 74,672 26.9
More than 5 years 38,991 25,159 64,150 23.1
246,329 31,538 277,867 100.0
2008
Less than one year 170,240 1,994 172,234 55.0
1-5 years 56,109 5,733 61,842 19.8
More than 5 years 43,109 35,951 79,060 25.2
269,458 43,678 313,136 100.0
Key points
xThe Group has improved its funding and liquidity position by
extending the average maturity of debt securities in issue.
xThe proportion of debt instruments with a remaining maturity of
greater than one year has increased in 2010 from 50% at 31
December 2009 to 61% at 31 December 2010.
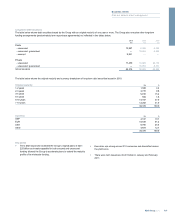
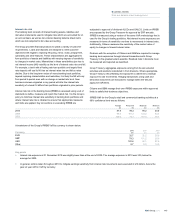
Short-term borrowings*
The table belowshows details of the Group’s short-term borrowings.
Short-term borrowings comprise repurchase agreements, borrowings from financial institutions, commercial paper and certification of deposit. Derivative
collateral received from financial institutions is excluded from the table below as are long-term borrowings by US Retail & Commercial from Federal
Home Loan Banks.
Repos
Financial
institutions
(1,2)
Commercial
paper
Certificates of
deposits
Total
2010
Total
2009
Total
2008
At year end
- balance (£bn) 115 42 26 38 221
242 347
- weighted average interest rate 0.5% 0.6% 0.7% 0.6% 0.6% 0.8% 3.8%
During the year
- maximum balance (£bn) 157 78 37 57 329
357 594
- average balance (£bn) 137 62 34 50 283
292 486
- weighted average interest rate 0.6% 0.8 % 0.9% 1.0% 0.7% 1.9% 4.2%
Notes:
(1) Excludes derivative cash collateral of £28 billion at 31 December 2010 (2009 - £33 billion; 2008 - £46 billion), 2010 average of £34 billion (2009 - £40 billion; 2008 - £20 billion).
(2) Includes federal funds purchased of £1.5 billion at 31 December 2010 (2009 - £3 billion; 2008 - £4 billion), 2010 average of £2 billion (2009 - £3 billion; 2008 - £3 billion).
Balances are generally based on monthly data. Average interest rates during the year are computed by dividing total interest expense by the average
amount borrowed. Average interest rates at year end are average rates for a single day and as such may reflect one-day market distortions which may
not be indicative of generally prevailing rates.
*unaudited
RBS Group 2010136
Business review continued