RBS 2010 Annual Report Download - page 130
Download and view the complete annual report
Please find page 130 of the 2010 RBS annual report below. You can navigate through the pages in the report by either clicking on the pages listed below, or by using the keyword search tool below to find specific information within the annual report.-
 1
1 -
2
-
3
-
4
-
5
-
6
-
7
-
8
-
9
-
10
-
11
-
12
-
13
-
14
-
15
-
16
-
17
-
18
-
19
-
20
-
21
-
22
-
23
-
24
-
25
-
26
-
27
-
28
-
29
-
30
-
31
-
32
-
33
-
34
-
35
-
36
-
37
-
38
-
39
-
40
-
41
-
42
-
43
-
44
-
45
-
46
-
47
-
48
-
49
-
50
-
51
-
52
-
53
-
54
-
55
-
56
-
57
-
58
-
59
-
60
-
61
-
62
-
63
-
64
-
65
-
66
-
67
-
68
-
69
-
70
-
71
-
72
-
73
-
74
-
75
-
76
-
77
-
78
-
79
-
80
-
81
-
82
-
83
-
84
-
85
-
86
-
87
-
88
-
89
-
90
-
91
-
92
-
93
-
94
-
95
-
96
-
97
-
98
-
99
-
100
-
101
-
102
-
103
-
104
-
105
-
106
-
107
-
108
-
109
-
110
-
111
-
112
-
113
-
114
-
115
-
116
-
117
-
118
-
119
-
 120
120 -
 121
121 -
 122
122 -
 123
123 -
 124
124 -
 125
125 -
 126
126 -
 127
127 -
 128
128 -
 129
129 -
 130
130 -
 131
131 -
 132
132 -
 133
133 -
 134
134 -
 135
135 -
 136
136 -
 137
137 -
 138
138 -
 139
139 -
 140
140 -
141
-
142
-
143
-
144
-
145
-
146
-
147
-
148
-
149
-
150
-
151
-
152
-
153
-
154
-
155
-
156
-
157
-
158
-
159
-
160
-
161
-
162
-
163
-
164
-
165
-
166
-
167
-
168
-
169
-
170
-
171
-
172
-
173
-
174
-
175
-
176
-
177
-
178
-
179
-
180
-
181
-
182
-
183
-
184
-
185
-
186
-
187
-
188
-
189
-
190
-
191
-
192
-
193
-
194
-
195
-
196
-
197
-
198
-
199
-
200
-
201
-
202
-
203
-
204
-
205
-
206
-
207
-
208
-
209
-
210
-
211
-
212
-
213
-
214
-
215
-
216
-
217
-
218
-
219
-
220
-
221
-
222
-
223
-
224
-
225
-
226
-
227
-
228
-
229
-
230
-
231
-
232
-
233
-
234
-
235
-
236
-
237
-
238
-
239
-
240
-
241
-
242
-
243
-
244
-
245
-
246
-
247
-
248
-
249
-
250
-
251
-
252
-
253
-
254
-
255
-
256
-
257
-
258
-
259
-
260
-
261
-
262
-
263
-
264
-
265
-
266
-
267
-
268
-
269
-
270
-
271
-
272
-
273
-
274
-
275
-
276
-
277
-
278
-
279
-
280
-
281
-
282
-
283
-
284
-
285
-
286
-
287
-
288
-
289
-
290
-
291
-
292
-
293
-
294
-
295
-
296
-
297
-
298
-
299
-
300
-
301
-
302
-
303
-
304
-
305
-
306
-
307
-
308
-
309
-
310
-
311
-
312
-
313
-
314
-
315
-
316
-
317
-
318
-
319
-
320
-
321
-
322
-
323
-
324
-
325
-
326
-
327
-
328
-
329
-
330
-
331
-
332
-
333
-
334
-
335
-
336
-
337
-
338
-
339
-
340
-
341
-
342
-
343
-
344
-
345
-
346
-
347
-
348
-
349
-
350
-
351
-
352
-
353
-
354
-
355
-
356
-
357
-
358
-
359
-
360
-
361
-
362
-
363
-
364
-
365
-
366
-
367
-
368
-
369
-
370
-
371
-
372
-
373
-
374
-
375
-
376
-
377
-
378
-
379
-
380
-
381
-
382
-
383
-
384
-
385
-
386
-
387
-
388
-
389
-
390
-
391
-
392
-
393
-
394
-
395
-
396
-
397
-
398
-
399
-
400
-
401
-
402
-
403
-
404
-
405
-
406
-
407
-
408
-
409
-
410
-
411
-
412
-
413
-
414
-
415
-
416
-
417
-
418
-
419
-
420
-
421
-
422
-
423
-
424
-
425
-
426
-
427
-
428
-
429
-
430
-
431
-
432
-
433
-
434
-
435
-
436
-
437
-
438
-
439
-
440
-
441
-
442
-
443
-
444
-
445
 |
 |

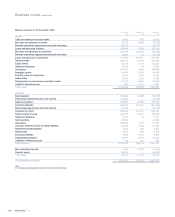
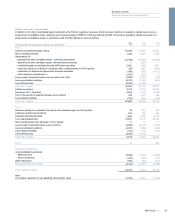
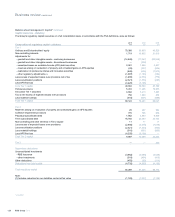
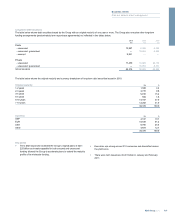
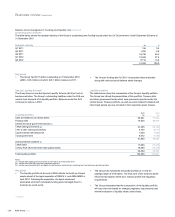
Balance sheet management: Capital* continued
Capital resources - statutory
The Group's regulatory capital resources on a full consolidation basis, in accordance with the FSA definitions, were as follows:
Composition of regulatory capital - statutory 2010
£m
2009
£m
2008
£m
Tier 1
Ordinary and B shareholders' equity 70,388 69,890 45,525
Non-controlling interests 1,719 16,895 21,619
Adjustments for:
-goodwill and other intangible assets - continuing businesses (14,448) (17,847) (20,049)
- goodwill and other intangible assets - discontinued businesses —(238) —
- unrealised losses on available-for-sale (AFS) debt securities 2,061 1,888 3,687
- reserves arising on revaluation of property and unrealised gains on AFS equities (25) (207) (984)
- reallocation of preference shares and innovative securities (548) (656) (1,813)
- other regulatory adjustments (1) (1,097) (1,184) (362)
Less excess of expected losses over provisions net of tax (1,900) (2,558) (770)
Less securitisation positions (2,321) (1,353) (663)
Less APS first loss (4,225) (5,106) —
Core Tier 1 capital 49,604 59,524 46,190
Preference shares 5,410 11,265 16,655
Innovative Tier 1 securities 4,662 5,213 7,383
Tax on the excess of expected losses over provisions 758 1,020 308
Less material holdings (310) (601) (689)
Total Tier 1 capital 60,124 76,421 69,847
Tier 2
Reserves arising on revaluation of property and unrealised gains on AFS equities 25 207 984
Collective impairment provisions 778 796 666
Perpetual subordinated debt 1,852 4,950 9,829
Term subordinated debt 16,745 20,063 23,162
Non-controlling and other interests in Tier 2 capital 11 11 11
Less excess of expected losses over provisions (2,658) (3,578) (1,078)
Less securitisation positions (2,321) (1,353) (662)
Less material holdings (310) (601) (689)
Less APS first loss (4,225) (5,106) —
Total Tier 2 capital 9,897 15,389 32,223
Tier 3 —— 260
Supervisory deductions
Unconsolidated investments
- RBS Insurance (3,962) (4,068) (3,628)
- other investments (318) (404) (416)
Other deductions (452) (93) (111)
Deductions from total capital (4,732) (4,565) (4,155)
Total regulatory capital 65,289 87,245 98,175
Note:
(1) Includes reduction for own liabilities carried at fair value (1,182) (1,057) (1,159)
*unaudited
RBS Group 2010128
Business review continued