RBS 2010 Annual Report Download - page 210
Download and view the complete annual report
Please find page 210 of the 2010 RBS annual report below. You can navigate through the pages in the report by either clicking on the pages listed below, or by using the keyword search tool below to find specific information within the annual report.-
 1
1 -
2
-
3
-
4
-
5
-
6
-
7
-
8
-
9
-
10
-
11
-
12
-
13
-
14
-
15
-
16
-
17
-
18
-
19
-
20
-
21
-
22
-
23
-
24
-
25
-
26
-
27
-
28
-
29
-
30
-
31
-
32
-
33
-
34
-
35
-
36
-
37
-
38
-
39
-
40
-
41
-
42
-
43
-
44
-
45
-
46
-
47
-
48
-
49
-
50
-
51
-
52
-
53
-
54
-
55
-
56
-
57
-
58
-
59
-
60
-
61
-
62
-
63
-
64
-
65
-
66
-
67
-
68
-
69
-
70
-
71
-
72
-
73
-
74
-
75
-
76
-
77
-
78
-
79
-
80
-
81
-
82
-
83
-
84
-
85
-
86
-
87
-
88
-
89
-
90
-
91
-
92
-
93
-
94
-
95
-
96
-
97
-
98
-
99
-
100
-
101
-
102
-
103
-
104
-
105
-
106
-
107
-
108
-
109
-
110
-
111
-
112
-
113
-
114
-
115
-
116
-
117
-
118
-
119
-
120
-
121
-
122
-
123
-
124
-
125
-
126
-
127
-
128
-
129
-
130
-
131
-
132
-
133
-
134
-
135
-
136
-
137
-
138
-
139
-
140
-
141
-
142
-
143
-
144
-
145
-
146
-
147
-
148
-
149
-
150
-
151
-
152
-
153
-
154
-
155
-
156
-
157
-
158
-
159
-
160
-
161
-
162
-
163
-
164
-
165
-
166
-
167
-
168
-
169
-
170
-
171
-
172
-
173
-
174
-
175
-
176
-
177
-
178
-
179
-
180
-
181
-
182
-
183
-
184
-
185
-
186
-
187
-
188
-
189
-
190
-
191
-
192
-
193
-
194
-
195
-
196
-
197
-
198
-
199
-
 200
200 -
 201
201 -
 202
202 -
 203
203 -
 204
204 -
 205
205 -
 206
206 -
 207
207 -
 208
208 -
 209
209 -
 210
210 -
 211
211 -
 212
212 -
 213
213 -
 214
214 -
 215
215 -
 216
216 -
 217
217 -
 218
218 -
 219
219 -
 220
220 -
221
-
222
-
223
-
224
-
225
-
226
-
227
-
228
-
229
-
230
-
231
-
232
-
233
-
234
-
235
-
236
-
237
-
238
-
239
-
240
-
241
-
242
-
243
-
244
-
245
-
246
-
247
-
248
-
249
-
250
-
251
-
252
-
253
-
254
-
255
-
256
-
257
-
258
-
259
-
260
-
261
-
262
-
263
-
264
-
265
-
266
-
267
-
268
-
269
-
270
-
271
-
272
-
273
-
274
-
275
-
276
-
277
-
278
-
279
-
280
-
281
-
282
-
283
-
284
-
285
-
286
-
287
-
288
-
289
-
290
-
291
-
292
-
293
-
294
-
295
-
296
-
297
-
298
-
299
-
300
-
301
-
302
-
303
-
304
-
305
-
306
-
307
-
308
-
309
-
310
-
311
-
312
-
313
-
314
-
315
-
316
-
317
-
318
-
319
-
320
-
321
-
322
-
323
-
324
-
325
-
326
-
327
-
328
-
329
-
330
-
331
-
332
-
333
-
334
-
335
-
336
-
337
-
338
-
339
-
340
-
341
-
342
-
343
-
344
-
345
-
346
-
347
-
348
-
349
-
350
-
351
-
352
-
353
-
354
-
355
-
356
-
357
-
358
-
359
-
360
-
361
-
362
-
363
-
364
-
365
-
366
-
367
-
368
-
369
-
370
-
371
-
372
-
373
-
374
-
375
-
376
-
377
-
378
-
379
-
380
-
381
-
382
-
383
-
384
-
385
-
386
-
387
-
388
-
389
-
390
-
391
-
392
-
393
-
394
-
395
-
396
-
397
-
398
-
399
-
400
-
401
-
402
-
403
-
404
-
405
-
406
-
407
-
408
-
409
-
410
-
411
-
412
-
413
-
414
-
415
-
416
-
417
-
418
-
419
-
420
-
421
-
422
-
423
-
424
-
425
-
426
-
427
-
428
-
429
-
430
-
431
-
432
-
433
-
434
-
435
-
436
-
437
-
438
-
439
-
440
-
441
-
442
-
443
-
444
-
445
 |
 |

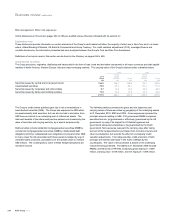
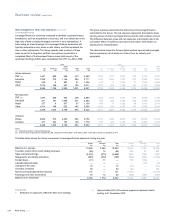
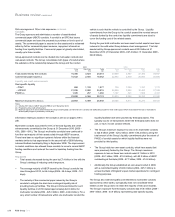
Risk management: Other risk exposures continued
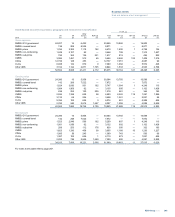
The table below summarises the rating levels of ABS carrying values. Credit ratings are based on those from rating agencies Standard & Poor’s (S&P),
Moody’s and Fitch and have been mapped onto the S&P scale.
AAA AA to AA+ A to AA- BBB- to A-
Non-investment
grade Unrated Total
2010 £m £m £m £m £m £m £m
RMBS: G10 government 28,835 1,529 — — — — 30,364
RMBS: covered bond 7,107 357 408 — — — 7,872
RMBS: prime 4,355 147 67 82 900 196 5,747
RMBS: non-conforming 1,754 144 60 316 809 52 3,135
RMBS: sub-prime 317 116 212 39 458 76 1,218
CMBS 2,789 392 973 500 296 — 4,950
CDOs 444 567 296 203 1,863 85 3,458
CLOs 2,490 1,786 343 527 332 596 6,074
Other ABS 3,144 1,297 885 1,718 265 698 8,007
51,235 6,335 3,244 3,385 4,923 1,703 70,825
2009
RMBS: G10 government 33,779 125 — — — — 33,904
RMBS: covered bond 8,645 360 67 — — — 9,072
RMBS: prime 9,211 676 507 547 558 1 11,500
RMBS: non-conforming 1,981 197 109 160 594 2 3,043
RMBS: sub-prime 578 121 306 87 579 153 1,824
CMBS 3,441 599 1,022 298 147 2 5,509
CDOs 615 944 254 944 849 262 3,868
CLOs 2,718 4,365 607 260 636 730 9,316
Other ABS 4,099 1,555 1,014 1,947 152 799 9,566
65,067 8,942 3,886 4,243 3,515 1,949 87,602
2008
RMBS: G10 government 41,168 — — 9 41,177
RMBS: covered bond 10,380 — — — 10,380
RMBS: prime 15,252 1,417 106 2 16,777
RMBS: non-conforming 3,532 337 146 2 4,017
RMBS: sub-prime 1,362 936 790 1 3,089
CMBS 3,702 1,586 38 1 5,327
CDOs 4,510 2,041 2,088 381 9,020
CLOs 7,299 1,601 268 449 9,617
Other ABS 6,649 3,519 242 1,329 11,739
93,854 — — 11,437 3,678 2,174 111,143
Key points
xCarrying values of asset-backed securities decreased by £16.8
billion during 2010 with net reductions across all portfolios.
xWithin G10 government RMBS, net sell-downs by the US
Mortgage Trading business in GBM in the first quarter of 2010, as
part of the Group’s repositioning in light of the US government’s
purchase of US assets was off-set by purchases in the second
half of the year, with the latter reflecting the perceived investor
appetite. The decrease in the US AFS portfolio reflected balance
sheet restructuring in US Retail & Commercial during the third
quarter of 2010.
xA£5.8 billion reduction was seen in prime RMBS primarily in
GBM and Group Treasury, across European (£4.7 billion) and US
(£1.1 billion) portfolios reflecting respectively balance sheet
management and repositioning in light of increased liquidity in the
US RMBS market.
xCDO and CLO portfolios declined by £3.7 billion reflecting asset
reductions in Non-Core; however, some CDO exposures were
downgraded during the year resulting in increased non-
investment grade positions.
RBS Group 2010208
Business review continued