RBS 2010 Annual Report Download - page 376
Download and view the complete annual report
Please find page 376 of the 2010 RBS annual report below. You can navigate through the pages in the report by either clicking on the pages listed below, or by using the keyword search tool below to find specific information within the annual report.-
 1
1 -
2
-
3
-
4
-
5
-
6
-
7
-
8
-
9
-
10
-
11
-
12
-
13
-
14
-
15
-
16
-
17
-
18
-
19
-
20
-
21
-
22
-
23
-
24
-
25
-
26
-
27
-
28
-
29
-
30
-
31
-
32
-
33
-
34
-
35
-
36
-
37
-
38
-
39
-
40
-
41
-
42
-
43
-
44
-
45
-
46
-
47
-
48
-
49
-
50
-
51
-
52
-
53
-
54
-
55
-
56
-
57
-
58
-
59
-
60
-
61
-
62
-
63
-
64
-
65
-
66
-
67
-
68
-
69
-
70
-
71
-
72
-
73
-
74
-
75
-
76
-
77
-
78
-
79
-
80
-
81
-
82
-
83
-
84
-
85
-
86
-
87
-
88
-
89
-
90
-
91
-
92
-
93
-
94
-
95
-
96
-
97
-
98
-
99
-
100
-
101
-
102
-
103
-
104
-
105
-
106
-
107
-
108
-
109
-
110
-
111
-
112
-
113
-
114
-
115
-
116
-
117
-
118
-
119
-
120
-
121
-
122
-
123
-
124
-
125
-
126
-
127
-
128
-
129
-
130
-
131
-
132
-
133
-
134
-
135
-
136
-
137
-
138
-
139
-
140
-
141
-
142
-
143
-
144
-
145
-
146
-
147
-
148
-
149
-
150
-
151
-
152
-
153
-
154
-
155
-
156
-
157
-
158
-
159
-
160
-
161
-
162
-
163
-
164
-
165
-
166
-
167
-
168
-
169
-
170
-
171
-
172
-
173
-
174
-
175
-
176
-
177
-
178
-
179
-
180
-
181
-
182
-
183
-
184
-
185
-
186
-
187
-
188
-
189
-
190
-
191
-
192
-
193
-
194
-
195
-
196
-
197
-
198
-
199
-
200
-
201
-
202
-
203
-
204
-
205
-
206
-
207
-
208
-
209
-
210
-
211
-
212
-
213
-
214
-
215
-
216
-
217
-
218
-
219
-
220
-
221
-
222
-
223
-
224
-
225
-
226
-
227
-
228
-
229
-
230
-
231
-
232
-
233
-
234
-
235
-
236
-
237
-
238
-
239
-
240
-
241
-
242
-
243
-
244
-
245
-
246
-
247
-
248
-
249
-
250
-
251
-
252
-
253
-
254
-
255
-
256
-
257
-
258
-
259
-
260
-
261
-
262
-
263
-
264
-
265
-
266
-
267
-
268
-
269
-
270
-
271
-
272
-
273
-
274
-
275
-
276
-
277
-
278
-
279
-
280
-
281
-
282
-
283
-
284
-
285
-
286
-
287
-
288
-
289
-
290
-
291
-
292
-
293
-
294
-
295
-
296
-
297
-
298
-
299
-
300
-
301
-
302
-
303
-
304
-
305
-
306
-
307
-
308
-
309
-
310
-
311
-
312
-
313
-
314
-
315
-
316
-
317
-
318
-
319
-
320
-
321
-
322
-
323
-
324
-
325
-
326
-
327
-
328
-
329
-
330
-
331
-
332
-
333
-
334
-
335
-
336
-
337
-
338
-
339
-
340
-
341
-
342
-
343
-
344
-
345
-
346
-
347
-
348
-
349
-
350
-
351
-
352
-
353
-
354
-
355
-
356
-
357
-
358
-
359
-
360
-
361
-
362
-
363
-
364
-
365
-
 366
366 -
 367
367 -
 368
368 -
 369
369 -
 370
370 -
 371
371 -
 372
372 -
 373
373 -
 374
374 -
 375
375 -
 376
376 -
 377
377 -
 378
378 -
 379
379 -
 380
380 -
 381
381 -
 382
382 -
 383
383 -
 384
384 -
 385
385 -
 386
386 -
387
-
388
-
389
-
390
-
391
-
392
-
393
-
394
-
395
-
396
-
397
-
398
-
399
-
400
-
401
-
402
-
403
-
404
-
405
-
406
-
407
-
408
-
409
-
410
-
411
-
412
-
413
-
414
-
415
-
416
-
417
-
418
-
419
-
420
-
421
-
422
-
423
-
424
-
425
-
426
-
427
-
428
-
429
-
430
-
431
-
432
-
433
-
434
-
435
-
436
-
437
-
438
-
439
-
440
-
441
-
442
-
443
-
444
-
445
 |
 |

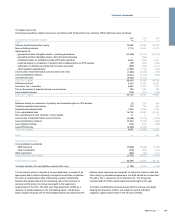
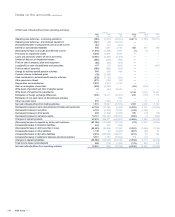
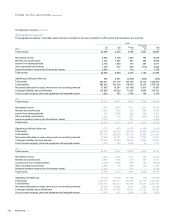
35 Net cash inflow/(outflow) from operating activities
Group Company
2010 2009 2008 2010 2009 2008
£m £m £m £m £m £m
Operating loss before tax - continuing operations (399) (2,647) (25,691) (4,471) (1,286) (10,017)
Operating loss before tax - discontinued operations (541) (49) (10,937) —— —
(Increase)/decrease in prepayments and accrued income (67) 433 (921) —— —
Interest on subordinated liabilities 500 1,490 2,144 462 537 499
(Decrease)/increase in accruals and deferred income (1,915) (1,538) 3,961 (1) (1) 7
Provisions for impairment losses 9,298 14,950 8,072 —— —
Loans and advances written-off net of recoveries (5,631) (6,540) (2,829) —— —
Unwind of discount on impairment losses (455) (408) (194) —— —
Profit on sale of property, plant and equipment (50) (43) (167) —— —
Loss/(profit) on sale of subsidiaries and associates 107 135 (943) —— (487)
Profit on sale of securities (496) (294) (342) —— —
Charge for defined benefit pension schemes 540 659 490 —— —
Pension scheme curtailment gains (78) (2,148) — —— —
Cash contribution to defined benefit pension schemes (832) (1,153) (810) —— —
Other provisions utilised (211) (159) (32) —— —
Depreciation and amortisation 2,220 2,809 3,154 —— —
Gain on redemption of own debt (553) (3,790) — (53) (238) —
Write-down of goodwill and other intangible assets 10 363 32,581 —— —
Write-down of investment in subsidiaries —— — 5,124 5,139 14,321
Elimination of foreign exchange differences (691) 12,217 (41,874) 272 (753) 1,778
Elimination of non-cash items on discontinued activities —— 592 —— —
Other non-cash items 875 1,404 2,167 —21 2
Net cash inflow/(outflow) from trading activities 1,631 15,691 (31,579) 1,333 3,419 6,103
Decrease/(increase) in loans and advances to banks and customers 42,766 151,568 (5,469) (6,300) 4,121 (15,542)
Decrease/(increase) in securities 8,723 (5,902) 75,964 (168) (1,286) —
Decrease/(increase) in other assets 445 (1,839) (5,845) 105 (10) (73)
Decrease/(increase) in derivative assets 10,741 544,744 (708,607) (306) (1) (995)
Changes in operating assets 62,675 688,571 (643,957) (6,669) 2,824 (16,610)
(Decrease)/increase in deposits by banks and customers (24,794) (131,685) (78,166) (78) 11,533 (4,064)
Increase/(decrease) in insurance liabilities 494 429 (186) —— —
(Decrease)/increase in debt securities in issue (28,493) (34,528) 27,222 (3,020) (1,828) (1,794)
Increase/(decrease) in other liabilities 1,108 20 (8,869) (267) (66) 32
Increase/(decrease) in derivative liabilities 2,454 (540,540) 699,601 (215) 85 182
Increase/(decrease) in settlement balances and short positions 3,651 1,769 (37,864) 11 (11) —
Changes in operating liabilities (45,580) (704,535) 601,738 (3,569) 9,713 (5,644)
Total income taxes received/(paid) 565 (719) (1,540) (133) 409 119
Net cash inflow/(outflow) from operating activities 19,291 (992) (75,338) (9,038) 16,365 (16,032)
RBS Group 2010374
Notes on the accounts continued