RBS 2010 Annual Report Download - page 340
Download and view the complete annual report
Please find page 340 of the 2010 RBS annual report below. You can navigate through the pages in the report by either clicking on the pages listed below, or by using the keyword search tool below to find specific information within the annual report.-
 1
1 -
2
-
3
-
4
-
5
-
6
-
7
-
8
-
9
-
10
-
11
-
12
-
13
-
14
-
15
-
16
-
17
-
18
-
19
-
20
-
21
-
22
-
23
-
24
-
25
-
26
-
27
-
28
-
29
-
30
-
31
-
32
-
33
-
34
-
35
-
36
-
37
-
38
-
39
-
40
-
41
-
42
-
43
-
44
-
45
-
46
-
47
-
48
-
49
-
50
-
51
-
52
-
53
-
54
-
55
-
56
-
57
-
58
-
59
-
60
-
61
-
62
-
63
-
64
-
65
-
66
-
67
-
68
-
69
-
70
-
71
-
72
-
73
-
74
-
75
-
76
-
77
-
78
-
79
-
80
-
81
-
82
-
83
-
84
-
85
-
86
-
87
-
88
-
89
-
90
-
91
-
92
-
93
-
94
-
95
-
96
-
97
-
98
-
99
-
100
-
101
-
102
-
103
-
104
-
105
-
106
-
107
-
108
-
109
-
110
-
111
-
112
-
113
-
114
-
115
-
116
-
117
-
118
-
119
-
120
-
121
-
122
-
123
-
124
-
125
-
126
-
127
-
128
-
129
-
130
-
131
-
132
-
133
-
134
-
135
-
136
-
137
-
138
-
139
-
140
-
141
-
142
-
143
-
144
-
145
-
146
-
147
-
148
-
149
-
150
-
151
-
152
-
153
-
154
-
155
-
156
-
157
-
158
-
159
-
160
-
161
-
162
-
163
-
164
-
165
-
166
-
167
-
168
-
169
-
170
-
171
-
172
-
173
-
174
-
175
-
176
-
177
-
178
-
179
-
180
-
181
-
182
-
183
-
184
-
185
-
186
-
187
-
188
-
189
-
190
-
191
-
192
-
193
-
194
-
195
-
196
-
197
-
198
-
199
-
200
-
201
-
202
-
203
-
204
-
205
-
206
-
207
-
208
-
209
-
210
-
211
-
212
-
213
-
214
-
215
-
216
-
217
-
218
-
219
-
220
-
221
-
222
-
223
-
224
-
225
-
226
-
227
-
228
-
229
-
230
-
231
-
232
-
233
-
234
-
235
-
236
-
237
-
238
-
239
-
240
-
241
-
242
-
243
-
244
-
245
-
246
-
247
-
248
-
249
-
250
-
251
-
252
-
253
-
254
-
255
-
256
-
257
-
258
-
259
-
260
-
261
-
262
-
263
-
264
-
265
-
266
-
267
-
268
-
269
-
270
-
271
-
272
-
273
-
274
-
275
-
276
-
277
-
278
-
279
-
280
-
281
-
282
-
283
-
284
-
285
-
286
-
287
-
288
-
289
-
290
-
291
-
292
-
293
-
294
-
295
-
296
-
297
-
298
-
299
-
300
-
301
-
302
-
303
-
304
-
305
-
306
-
307
-
308
-
309
-
310
-
311
-
312
-
313
-
314
-
315
-
316
-
317
-
318
-
319
-
320
-
321
-
322
-
323
-
324
-
325
-
326
-
327
-
328
-
329
-
 330
330 -
 331
331 -
 332
332 -
 333
333 -
 334
334 -
 335
335 -
 336
336 -
 337
337 -
 338
338 -
 339
339 -
 340
340 -
 341
341 -
 342
342 -
 343
343 -
 344
344 -
 345
345 -
 346
346 -
 347
347 -
 348
348 -
 349
349 -
 350
350 -
351
-
352
-
353
-
354
-
355
-
356
-
357
-
358
-
359
-
360
-
361
-
362
-
363
-
364
-
365
-
366
-
367
-
368
-
369
-
370
-
371
-
372
-
373
-
374
-
375
-
376
-
377
-
378
-
379
-
380
-
381
-
382
-
383
-
384
-
385
-
386
-
387
-
388
-
389
-
390
-
391
-
392
-
393
-
394
-
395
-
396
-
397
-
398
-
399
-
400
-
401
-
402
-
403
-
404
-
405
-
406
-
407
-
408
-
409
-
410
-
411
-
412
-
413
-
414
-
415
-
416
-
417
-
418
-
419
-
420
-
421
-
422
-
423
-
424
-
425
-
426
-
427
-
428
-
429
-
430
-
431
-
432
-
433
-
434
-
435
-
436
-
437
-
438
-
439
-
440
-
441
-
442
-
443
-
444
-
445
 |
 |

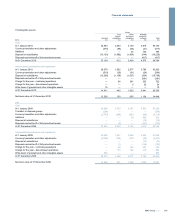
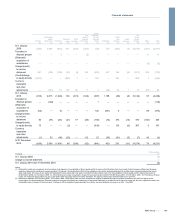
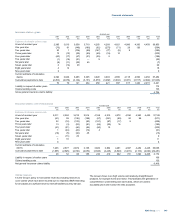
20 Property, plant and equipment
Group
Investment
properties
Freehold
premises
Long
leasehold
premises
Short
leasehold
premises
Computers
and other
equipment
Operating
lease
assets Total
2010 £m £m £m £m £m £m £m
Cost or valuation
At 1 January 2010 4,883 4,098 214 1,803 4,282 9,558 24,838
Currency translation and other adjustments —31 2 81 227 231 572
Disposal of subsidiaries —(1,118) — (104) (372) (369) (1,963)
Reclassifications —(104) 76 15 13 — —
Additions 511 103 5 137 411 1,178 2,345
Expenditure on investment properties 2 — — — — — 2
Change in fair value of investment properties (405) — — — — — (405)
Disposals and write-off of fully depreciated assets (821) (72) (6) (100) (322) (1,363) (2,684)
At 31 December 2010 4,170 2,938 291 1,832 4,239 9,235 22,705
Accumulated impairment, depreciation and amortisation
At 1 January 2010 —553 87 641 2,396 1,764 5,441
Currency translation and other adjustments —62 1 75 199 17 354
Disposal of subsidiaries —(24) — (30) (197) (141) (392)
Reclassifications —(17) 17 — — — —
Write down of property, plant and equipment —32 4 1 4 — 41
Disposals and write-off of fully depreciated assets —(10) (2) (48) (261) (435) (756)
Charge for the year - continuing operations —106 11 148 536 627 1,428
Charge for the year - discontinued operations — — — 6 23 17 46
At 31 December 2010 —702 118 793 2,700 1,849 6,162
Net book value at 31 December 2010 4,170 2,236 173 1,039 1,539 7,386 16,543
2009
Cost or valuation
At 1 January 2009 3,868 4,032 224 1,867 4,168 9,334 23,493
Transfers to disposal groups —(32) — (62) (80) — (174)
Currency translation and other adjustments (85) (134) — (65) (131) (561) (976)
Disposal of subsidiaries —(15) — — (19) — (34)
Reclassifications 118 1 (34) 14 — —
Additions 1,634 304 8 153 750 2,241 5,090
Expenditure on investment properties 8 — — — — — 8
Change in fair value of investment properties (117) — — — — — (117)
Disposals and write-off of fully depreciated assets (426) (75) (19) (56) (420) (1,456) (2,452)
At 31 December 2009 4,883 4,098 214 1,803 4,282 9,558 24,838
Accumulated impairment, depreciation and amortisation
At 1 January 2009 —422 79 492 1,916 1,635 4,544
Transfers to disposal groups — — — (7) (31) — (38)
Currency translation and other adjustments —(1) — (11) (48) (69) (129)
Disposal of subsidiaries —(1) — — (14) — (15)
Write down of property, plant and equipment — 5 — 5 — — 10
Disposals and write-off of fully depreciated assets — — — (2) (126) (419) (547)
Charge for the year - continuing operations —92 8 142 621 564 1,427
Charge for the year - discontinued operations —36 — 22 78 53 189
At 31 December 2009 —553 87 641 2,396 1,764 5,441
Net book value at 31 December 2009 4,883 3,545 127 1,162 1,886 7,794 19,397
RBS Group 2010338
Notes on the accounts continued