RBS 2010 Annual Report Download - page 255
Download and view the complete annual report
Please find page 255 of the 2010 RBS annual report below. You can navigate through the pages in the report by either clicking on the pages listed below, or by using the keyword search tool below to find specific information within the annual report.-
 1
1 -
2
-
3
-
4
-
5
-
6
-
7
-
8
-
9
-
10
-
11
-
12
-
13
-
14
-
15
-
16
-
17
-
18
-
19
-
20
-
21
-
22
-
23
-
24
-
25
-
26
-
27
-
28
-
29
-
30
-
31
-
32
-
33
-
34
-
35
-
36
-
37
-
38
-
39
-
40
-
41
-
42
-
43
-
44
-
45
-
46
-
47
-
48
-
49
-
50
-
51
-
52
-
53
-
54
-
55
-
56
-
57
-
58
-
59
-
60
-
61
-
62
-
63
-
64
-
65
-
66
-
67
-
68
-
69
-
70
-
71
-
72
-
73
-
74
-
75
-
76
-
77
-
78
-
79
-
80
-
81
-
82
-
83
-
84
-
85
-
86
-
87
-
88
-
89
-
90
-
91
-
92
-
93
-
94
-
95
-
96
-
97
-
98
-
99
-
100
-
101
-
102
-
103
-
104
-
105
-
106
-
107
-
108
-
109
-
110
-
111
-
112
-
113
-
114
-
115
-
116
-
117
-
118
-
119
-
120
-
121
-
122
-
123
-
124
-
125
-
126
-
127
-
128
-
129
-
130
-
131
-
132
-
133
-
134
-
135
-
136
-
137
-
138
-
139
-
140
-
141
-
142
-
143
-
144
-
145
-
146
-
147
-
148
-
149
-
150
-
151
-
152
-
153
-
154
-
155
-
156
-
157
-
158
-
159
-
160
-
161
-
162
-
163
-
164
-
165
-
166
-
167
-
168
-
169
-
170
-
171
-
172
-
173
-
174
-
175
-
176
-
177
-
178
-
179
-
180
-
181
-
182
-
183
-
184
-
185
-
186
-
187
-
188
-
189
-
190
-
191
-
192
-
193
-
194
-
195
-
196
-
197
-
198
-
199
-
200
-
201
-
202
-
203
-
204
-
205
-
206
-
207
-
208
-
209
-
210
-
211
-
212
-
213
-
214
-
215
-
216
-
217
-
218
-
219
-
220
-
221
-
222
-
223
-
224
-
225
-
226
-
227
-
228
-
229
-
230
-
231
-
232
-
233
-
234
-
235
-
236
-
237
-
238
-
239
-
240
-
241
-
242
-
243
-
244
-
 245
245 -
 246
246 -
 247
247 -
 248
248 -
 249
249 -
 250
250 -
 251
251 -
 252
252 -
 253
253 -
 254
254 -
 255
255 -
 256
256 -
 257
257 -
 258
258 -
 259
259 -
 260
260 -
 261
261 -
 262
262 -
 263
263 -
 264
264 -
 265
265 -
266
-
267
-
268
-
269
-
270
-
271
-
272
-
273
-
274
-
275
-
276
-
277
-
278
-
279
-
280
-
281
-
282
-
283
-
284
-
285
-
286
-
287
-
288
-
289
-
290
-
291
-
292
-
293
-
294
-
295
-
296
-
297
-
298
-
299
-
300
-
301
-
302
-
303
-
304
-
305
-
306
-
307
-
308
-
309
-
310
-
311
-
312
-
313
-
314
-
315
-
316
-
317
-
318
-
319
-
320
-
321
-
322
-
323
-
324
-
325
-
326
-
327
-
328
-
329
-
330
-
331
-
332
-
333
-
334
-
335
-
336
-
337
-
338
-
339
-
340
-
341
-
342
-
343
-
344
-
345
-
346
-
347
-
348
-
349
-
350
-
351
-
352
-
353
-
354
-
355
-
356
-
357
-
358
-
359
-
360
-
361
-
362
-
363
-
364
-
365
-
366
-
367
-
368
-
369
-
370
-
371
-
372
-
373
-
374
-
375
-
376
-
377
-
378
-
379
-
380
-
381
-
382
-
383
-
384
-
385
-
386
-
387
-
388
-
389
-
390
-
391
-
392
-
393
-
394
-
395
-
396
-
397
-
398
-
399
-
400
-
401
-
402
-
403
-
404
-
405
-
406
-
407
-
408
-
409
-
410
-
411
-
412
-
413
-
414
-
415
-
416
-
417
-
418
-
419
-
420
-
421
-
422
-
423
-
424
-
425
-
426
-
427
-
428
-
429
-
430
-
431
-
432
-
433
-
434
-
435
-
436
-
437
-
438
-
439
-
440
-
441
-
442
-
443
-
444
-
445
 |
 |

Core bank Economic Profit is defined as return attributable to
shareholders less equity multiplied by the cost of equity:
xreturn attributable to shareholders is Core Operating Profit reported
in the financial statements, excluding fair value of own debt and APS,
taxed at a standard tax rate of 28%.
xequity is defined as tangible equity allocated to the Core businesses,
with adjustments to strip out distorting impacts arising from fair value
of own debt, available-for-sale reserves, cashflow hedging reserve,
and APS.
xcurrent cost of equity is 12%, which is subject to review at least
annually.
Targets have been set so that maximum vesting under the awards is only
achieved for performance ahead of the Group’s refreshed Strategic Plan.
25% of this portion of the award will vest at threshold performance.
Threshold vesting requires average return on tangible equity over the
performance period at a reasonable margin above the cost of capital.
Due to the commercially sensitive nature of these targets details of the
actual targets, and performance against these, will be disclosed
retrospectively once the award vests.
Balance Sheet & Risk and Strategic Scorecard (applying to 50% of
overall 2011 LTIP award in total)
For the 2011 awards, 25% of the overall award will vest based on
achievement of Balance Sheet & Risk targets and 25% of the overall
award will vest on achievement of Strategic Scorecard targets, over a
three year period.
These measures have been chosen to complement the Core bank
Economic Profit and Relative TSR measures in aligning the LTIP with the
advancement of the strategic position and capability of the organisation
and the building of a sustainable business. The 2011 measures will have
aparticular focus on risk reduction, the resolution of the Non-Core
business and the building of a sustainable and responsible franchise for
the Group.
To ensure that the Group is positioned to deliver sustainable value for
shareholders beyond the initial turnaround timeframe, the balanced
Strategic Scorecard rewards management for delivering a robust basis
for future growth in terms of the strength of our franchise, efficiency,
reputation, and the strength and engagement of our employees.
For the first of these awards, the Remuneration Committee will assess
and judge performance against the measures set out below.
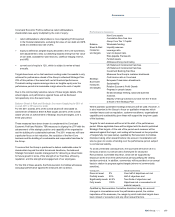
Performance measures
Non-Core assets
Cumulative Non-Core loss
Group Core Tier 1 Capital
Wholesale funding
Liquidity reserves
Leverage ratio
Loan to deposit ratio
Risk Appetite Framework
Funded assets
Balance
Sheet & Risk
measures
and targets
Attributes driving credit rating
UK Retail and Commercial franchise
US Retail and Commercial franchise
Investment Banking franchise
Measures from Group’s customer dashboard
Cost:income ratio in Core bank
European Commission divestments
Sustainability
Relative Economic Profit Growth
Progress in people issues
Embed strategic thinking, balanced business
evolution
Strategic
Scorecard
measures
and targets
Majority of Group’s divisions to have met the ‘5 tests’
at heart of the Strategic Plan
Where possible, quantitative strategic measures will be used. However, it
is also important to the Group to focus on qualitative measures which
consider issues such as reputation, customer excellence, organisational
capability and sustainability given these will support the long term goals
of the business.
Targets for each measure will be set at the start of the performance
period. Where applicable these will be aligned with the bank’s published
Strategic Plan targets. At the end of the period each measure will be
assessed against the target, and vesting will be based on the proportion
of targets fully met (see below), qualified by Remuneration Committee
discretion taking other relevant factors into account. Consideration will
also be given to volume of lending over the performance period, subject
to commercial viability.
To avoid unintended consequences, the scorecard will not be set in a
formulaic manner, but will provide a framework for structured
Remuneration Committee discretion, which will be supported by
disclosure at the end of the performance period justifying the vesting
decision arrived at. In addition, commentary will be provided on an annual
basis in relation to progress against targets (where not commercially
sensitive).
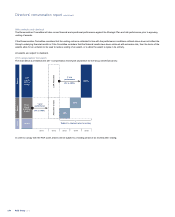
Vesting point Indicative performance
Does not meet 0% Over half of objectives not met
Partially meets 25% Half of objectives met
Significantly meets 62.5% Two-thirds of objectives met
Fully meets 100% Objectives met or exceeded in all
material respects
Qualified by Remuneration Committee discretion taking into account
changes in circumstances over the performance period, the relative
importance of the measures, the margin by which individual targets have
been missed or exceeded, and any other relevant factors.
253RBS Group 2010
Governance