RBS 2010 Annual Report Download - page 367
Download and view the complete annual report
Please find page 367 of the 2010 RBS annual report below. You can navigate through the pages in the report by either clicking on the pages listed below, or by using the keyword search tool below to find specific information within the annual report.-
 1
1 -
2
-
3
-
4
-
5
-
6
-
7
-
8
-
9
-
10
-
11
-
12
-
13
-
14
-
15
-
16
-
17
-
18
-
19
-
20
-
21
-
22
-
23
-
24
-
25
-
26
-
27
-
28
-
29
-
30
-
31
-
32
-
33
-
34
-
35
-
36
-
37
-
38
-
39
-
40
-
41
-
42
-
43
-
44
-
45
-
46
-
47
-
48
-
49
-
50
-
51
-
52
-
53
-
54
-
55
-
56
-
57
-
58
-
59
-
60
-
61
-
62
-
63
-
64
-
65
-
66
-
67
-
68
-
69
-
70
-
71
-
72
-
73
-
74
-
75
-
76
-
77
-
78
-
79
-
80
-
81
-
82
-
83
-
84
-
85
-
86
-
87
-
88
-
89
-
90
-
91
-
92
-
93
-
94
-
95
-
96
-
97
-
98
-
99
-
100
-
101
-
102
-
103
-
104
-
105
-
106
-
107
-
108
-
109
-
110
-
111
-
112
-
113
-
114
-
115
-
116
-
117
-
118
-
119
-
120
-
121
-
122
-
123
-
124
-
125
-
126
-
127
-
128
-
129
-
130
-
131
-
132
-
133
-
134
-
135
-
136
-
137
-
138
-
139
-
140
-
141
-
142
-
143
-
144
-
145
-
146
-
147
-
148
-
149
-
150
-
151
-
152
-
153
-
154
-
155
-
156
-
157
-
158
-
159
-
160
-
161
-
162
-
163
-
164
-
165
-
166
-
167
-
168
-
169
-
170
-
171
-
172
-
173
-
174
-
175
-
176
-
177
-
178
-
179
-
180
-
181
-
182
-
183
-
184
-
185
-
186
-
187
-
188
-
189
-
190
-
191
-
192
-
193
-
194
-
195
-
196
-
197
-
198
-
199
-
200
-
201
-
202
-
203
-
204
-
205
-
206
-
207
-
208
-
209
-
210
-
211
-
212
-
213
-
214
-
215
-
216
-
217
-
218
-
219
-
220
-
221
-
222
-
223
-
224
-
225
-
226
-
227
-
228
-
229
-
230
-
231
-
232
-
233
-
234
-
235
-
236
-
237
-
238
-
239
-
240
-
241
-
242
-
243
-
244
-
245
-
246
-
247
-
248
-
249
-
250
-
251
-
252
-
253
-
254
-
255
-
256
-
257
-
258
-
259
-
260
-
261
-
262
-
263
-
264
-
265
-
266
-
267
-
268
-
269
-
270
-
271
-
272
-
273
-
274
-
275
-
276
-
277
-
278
-
279
-
280
-
281
-
282
-
283
-
284
-
285
-
286
-
287
-
288
-
289
-
290
-
291
-
292
-
293
-
294
-
295
-
296
-
297
-
298
-
299
-
300
-
301
-
302
-
303
-
304
-
305
-
306
-
307
-
308
-
309
-
310
-
311
-
312
-
313
-
314
-
315
-
316
-
317
-
318
-
319
-
320
-
321
-
322
-
323
-
324
-
325
-
326
-
327
-
328
-
329
-
330
-
331
-
332
-
333
-
334
-
335
-
336
-
337
-
338
-
339
-
340
-
341
-
342
-
343
-
344
-
345
-
346
-
347
-
348
-
349
-
350
-
351
-
352
-
353
-
354
-
355
-
356
-
 357
357 -
 358
358 -
 359
359 -
 360
360 -
 361
361 -
 362
362 -
 363
363 -
 364
364 -
 365
365 -
 366
366 -
 367
367 -
 368
368 -
 369
369 -
 370
370 -
 371
371 -
 372
372 -
 373
373 -
 374
374 -
 375
375 -
 376
376 -
 377
377 -
378
-
379
-
380
-
381
-
382
-
383
-
384
-
385
-
386
-
387
-
388
-
389
-
390
-
391
-
392
-
393
-
394
-
395
-
396
-
397
-
398
-
399
-
400
-
401
-
402
-
403
-
404
-
405
-
406
-
407
-
408
-
409
-
410
-
411
-
412
-
413
-
414
-
415
-
416
-
417
-
418
-
419
-
420
-
421
-
422
-
423
-
424
-
425
-
426
-
427
-
428
-
429
-
430
-
431
-
432
-
433
-
434
-
435
-
436
-
437
-
438
-
439
-
440
-
441
-
442
-
443
-
444
-
445
 |
 |

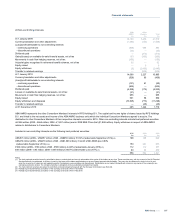
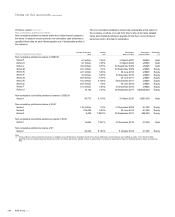
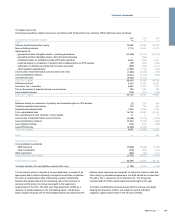
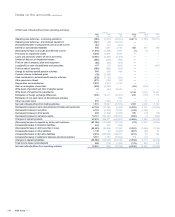
33 Capital resources
The Group's regulatory capital resources in accordance with Financial Services Authority (FSA) definitions were as follows:
Composition of regulatory capital 2010
£m
2009
£m
2008
£m
Tier 1
Ordinary and B shareholders' equity 70,388 69,890 45,525
Non-controlling interests 1,719 16,895 21,619
Adjustments for:
-goodwill and other intangible assets - continuing businesses (14,448) (17,847) (20,049)
- goodwill and other intangible assets - discontinued businesses —(238) —
- unrealised losses on available-for-sale (AFS) debt securities 2,061 1,888 3,687
-reserves arising on revaluation of property and unrealised gains on AFS equities (25) (207) (984)
- reallocation of preference shares and innovative securities (548) (656) (1,813)
- other regulatory adjustments* (1,097) (1,184) (362)
Less excess of expected losses over provisions net of tax (1,900) (2,558) (770)
Less securitisation positions (2,321) (1,353) (663)
Less APS first loss (4,225) (5,106) —
Core Tier 1 capital 49,604 59,524 46,190
Preference shares 5,410 11,265 16,655
Innovative Tier 1 securities 4,662 5,213 7,383
Tax on the excess of expected losses over provisions 758 1,020 308
Less material holdings (310) (601) (689)
Total Tier 1 capital 60,124 76,421 69,847
Tier 2
Reserves arising on revaluation of property and unrealised gains on AFS equities 25 207 984
Collective impairment provisions 778 796 666
Perpetual subordinated debt 1,852 4,950 9,829
Term subordinated debt 16,745 20,063 23,162
Non-controlling and other interests in Tier 2 capital 11 11 11
Less excess of expected losses over provisions (2,658) (3,578) (1,078)
Less securitisation positions (2,321) (1,353) (662)
Less material holdings (310) (601) (689)
Less APS first loss (4,225) (5,106) —
Total Tier 2 capital 9,897 15,389 32,223
Tier 3 —— 260
Supervisory deductions
Unconsolidated investments
- RBS Insurance (3,962) (4,068) (3,628)
- other investments (318) (404) (416)
Other deductions (452) (93) (111)
Deductions from total capital (4,732) (4,565) (4,155)
Total regulatory capital 65,289 87,245 98,175
*Includes reduction for own liabilities carried at fair value (1,182) (1,057) (1,159)
It is the Group's policy to maintain a strong capital base, to expand it as
appropriate and to utilise it efficiently throughout its activities to optimise
the return to shareholders while maintaining a prudent relationship
between the capital base and the underlying risks of the business. In
carrying out this policy, the Group has regard to the supervisory
requirements of the FSA. The FSA uses Risk Asset Ratio (RAR) as a
measure of capital adequacy in the UK banking sector, comparing a
bank's capital resources with its risk-weighted assets (the assets and off-
balance sheet exposures are ‘weighted’ to reflect the inherent credit and
other risks); by international agreement, the RAR should be not less than
8% with a Tier 1 component of not less than 4%. The Group has
complied with the FSA’s capital requirements throughout the year.
Anumber of subsidiaries and sub-groups within the Group, principally
banking and insurance entities, are subject to various individual
regulatory capital requirements in the UK and overseas.
365RBS Group 2010
Financial statements