RBS 2010 Annual Report Download - page 395
Download and view the complete annual report
Please find page 395 of the 2010 RBS annual report below. You can navigate through the pages in the report by either clicking on the pages listed below, or by using the keyword search tool below to find specific information within the annual report.-
 1
1 -
2
-
3
-
4
-
5
-
6
-
7
-
8
-
9
-
10
-
11
-
12
-
13
-
14
-
15
-
16
-
17
-
18
-
19
-
20
-
21
-
22
-
23
-
24
-
25
-
26
-
27
-
28
-
29
-
30
-
31
-
32
-
33
-
34
-
35
-
36
-
37
-
38
-
39
-
40
-
41
-
42
-
43
-
44
-
45
-
46
-
47
-
48
-
49
-
50
-
51
-
52
-
53
-
54
-
55
-
56
-
57
-
58
-
59
-
60
-
61
-
62
-
63
-
64
-
65
-
66
-
67
-
68
-
69
-
70
-
71
-
72
-
73
-
74
-
75
-
76
-
77
-
78
-
79
-
80
-
81
-
82
-
83
-
84
-
85
-
86
-
87
-
88
-
89
-
90
-
91
-
92
-
93
-
94
-
95
-
96
-
97
-
98
-
99
-
100
-
101
-
102
-
103
-
104
-
105
-
106
-
107
-
108
-
109
-
110
-
111
-
112
-
113
-
114
-
115
-
116
-
117
-
118
-
119
-
120
-
121
-
122
-
123
-
124
-
125
-
126
-
127
-
128
-
129
-
130
-
131
-
132
-
133
-
134
-
135
-
136
-
137
-
138
-
139
-
140
-
141
-
142
-
143
-
144
-
145
-
146
-
147
-
148
-
149
-
150
-
151
-
152
-
153
-
154
-
155
-
156
-
157
-
158
-
159
-
160
-
161
-
162
-
163
-
164
-
165
-
166
-
167
-
168
-
169
-
170
-
171
-
172
-
173
-
174
-
175
-
176
-
177
-
178
-
179
-
180
-
181
-
182
-
183
-
184
-
185
-
186
-
187
-
188
-
189
-
190
-
191
-
192
-
193
-
194
-
195
-
196
-
197
-
198
-
199
-
200
-
201
-
202
-
203
-
204
-
205
-
206
-
207
-
208
-
209
-
210
-
211
-
212
-
213
-
214
-
215
-
216
-
217
-
218
-
219
-
220
-
221
-
222
-
223
-
224
-
225
-
226
-
227
-
228
-
229
-
230
-
231
-
232
-
233
-
234
-
235
-
236
-
237
-
238
-
239
-
240
-
241
-
242
-
243
-
244
-
245
-
246
-
247
-
248
-
249
-
250
-
251
-
252
-
253
-
254
-
255
-
256
-
257
-
258
-
259
-
260
-
261
-
262
-
263
-
264
-
265
-
266
-
267
-
268
-
269
-
270
-
271
-
272
-
273
-
274
-
275
-
276
-
277
-
278
-
279
-
280
-
281
-
282
-
283
-
284
-
285
-
286
-
287
-
288
-
289
-
290
-
291
-
292
-
293
-
294
-
295
-
296
-
297
-
298
-
299
-
300
-
301
-
302
-
303
-
304
-
305
-
306
-
307
-
308
-
309
-
310
-
311
-
312
-
313
-
314
-
315
-
316
-
317
-
318
-
319
-
320
-
321
-
322
-
323
-
324
-
325
-
326
-
327
-
328
-
329
-
330
-
331
-
332
-
333
-
334
-
335
-
336
-
337
-
338
-
339
-
340
-
341
-
342
-
343
-
344
-
345
-
346
-
347
-
348
-
349
-
350
-
351
-
352
-
353
-
354
-
355
-
356
-
357
-
358
-
359
-
360
-
361
-
362
-
363
-
364
-
365
-
366
-
367
-
368
-
369
-
370
-
371
-
372
-
373
-
374
-
375
-
376
-
377
-
378
-
379
-
380
-
381
-
382
-
383
-
384
-
 385
385 -
 386
386 -
 387
387 -
 388
388 -
 389
389 -
 390
390 -
 391
391 -
 392
392 -
 393
393 -
 394
394 -
 395
395 -
 396
396 -
 397
397 -
 398
398 -
 399
399 -
 400
400 -
 401
401 -
 402
402 -
 403
403 -
 404
404 -
 405
405 -
406
-
407
-
408
-
409
-
410
-
411
-
412
-
413
-
414
-
415
-
416
-
417
-
418
-
419
-
420
-
421
-
422
-
423
-
424
-
425
-
426
-
427
-
428
-
429
-
430
-
431
-
432
-
433
-
434
-
435
-
436
-
437
-
438
-
439
-
440
-
441
-
442
-
443
-
444
-
445
 |
 |

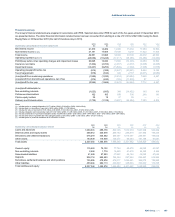
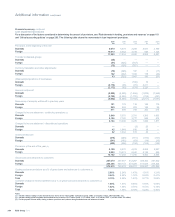
Risk elements in lending and potential problem loans
The Group's loan control and review procedures do not include the
classification of loans as impaired, accruing past due, restructured and
potential problem loans, as defined by the SEC in the US.
The following table shows the estimated amount of loans that would be
reported using the SEC's classifications. The figures are stated before
deducting the value of security held or related provisions.
2010
£m
2009
£m
2008
£m
2007
£m
2006
£m
Loans accounted for on an impaired basis (2)
Domestic 15,471 13,572 8,588 5,599 5,420
Foreign 20,230 21,453 10,891 4,763 812
Total 35,701 35,025 19,479 10,362 6,232
Accruing loans which are contractually overdue 90 days or more as to
principal or interest (3)
Domestic 2,363 2,224 1,201 217 81
Foreign 534 1,000 581 152 24
Total 2,897 3,224 1,782 369 105
Total risk elements in lending 38,598 38,249 21,261 10,731 6,337
Potential problem loans (4)
Domestic 506 424 218 63 47
Foreign 127 585 8 608 5
Total potential problem loans 633 1,009 226 671 52
Closing provisions for impairment as a % of total risk elements in lending 47% 46% 52% 60% 62%
Closing provisions for impairment as a % of total risk elements in lending and
potential problem loans 46% 45% 51% 57% 62%
Risk elements in lending as a % of gross lending to customers excluding
reverse repos (5) 7.3% 5.4% 2.5% 1.6% 1.6%
Notes:
(1) For the analysis above, 'Domestic' consists of the United Kingdom domestic transactions of the Group. 'Foreign' comprises the Group's transactions conducted through offices outside the UK and
through those offices in the UK specifically organised to service international banking transactions.
(2) All loans against which an impairment provision is held are reported in the impaired category.
(3) Loans where an impairment event has taken place but no impairment recognised. This category is used for fully collateralised non-revolving credit facilities.
(4) Loans for which an impairment event has occurred but no impairment provision is necessary. This category is used for fully collateralised advances and revolving credit facilities where identification
as 90 days overdue is not feasible.
(5) Gross of provisions and excluding reverse repurchase agreements. Includes gross lending relating to disposal groups in 2010 and 2009.
2010
£m
2009
£m
2008
£m
2007
£m
2006
£m
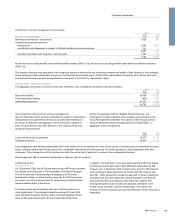
Gross income not recognised but which would have been recognised under the
original terms of impaired loans
Domestic 579 625 393 390 370
Foreign 830 1,032 338 64 77
1,409 1,657 731 454 447
Interest on impaired and restructured loans included in net interest income
Domestic 214 226 150 165 142
Foreign 241 182 42 15 15
455 408 192 180 157
393RBS Group 2010
Additional information