RBS 2010 Annual Report Download - page 359
Download and view the complete annual report
Please find page 359 of the 2010 RBS annual report below. You can navigate through the pages in the report by either clicking on the pages listed below, or by using the keyword search tool below to find specific information within the annual report.-
 1
1 -
2
-
3
-
4
-
5
-
6
-
7
-
8
-
9
-
10
-
11
-
12
-
13
-
14
-
15
-
16
-
17
-
18
-
19
-
20
-
21
-
22
-
23
-
24
-
25
-
26
-
27
-
28
-
29
-
30
-
31
-
32
-
33
-
34
-
35
-
36
-
37
-
38
-
39
-
40
-
41
-
42
-
43
-
44
-
45
-
46
-
47
-
48
-
49
-
50
-
51
-
52
-
53
-
54
-
55
-
56
-
57
-
58
-
59
-
60
-
61
-
62
-
63
-
64
-
65
-
66
-
67
-
68
-
69
-
70
-
71
-
72
-
73
-
74
-
75
-
76
-
77
-
78
-
79
-
80
-
81
-
82
-
83
-
84
-
85
-
86
-
87
-
88
-
89
-
90
-
91
-
92
-
93
-
94
-
95
-
96
-
97
-
98
-
99
-
100
-
101
-
102
-
103
-
104
-
105
-
106
-
107
-
108
-
109
-
110
-
111
-
112
-
113
-
114
-
115
-
116
-
117
-
118
-
119
-
120
-
121
-
122
-
123
-
124
-
125
-
126
-
127
-
128
-
129
-
130
-
131
-
132
-
133
-
134
-
135
-
136
-
137
-
138
-
139
-
140
-
141
-
142
-
143
-
144
-
145
-
146
-
147
-
148
-
149
-
150
-
151
-
152
-
153
-
154
-
155
-
156
-
157
-
158
-
159
-
160
-
161
-
162
-
163
-
164
-
165
-
166
-
167
-
168
-
169
-
170
-
171
-
172
-
173
-
174
-
175
-
176
-
177
-
178
-
179
-
180
-
181
-
182
-
183
-
184
-
185
-
186
-
187
-
188
-
189
-
190
-
191
-
192
-
193
-
194
-
195
-
196
-
197
-
198
-
199
-
200
-
201
-
202
-
203
-
204
-
205
-
206
-
207
-
208
-
209
-
210
-
211
-
212
-
213
-
214
-
215
-
216
-
217
-
218
-
219
-
220
-
221
-
222
-
223
-
224
-
225
-
226
-
227
-
228
-
229
-
230
-
231
-
232
-
233
-
234
-
235
-
236
-
237
-
238
-
239
-
240
-
241
-
242
-
243
-
244
-
245
-
246
-
247
-
248
-
249
-
250
-
251
-
252
-
253
-
254
-
255
-
256
-
257
-
258
-
259
-
260
-
261
-
262
-
263
-
264
-
265
-
266
-
267
-
268
-
269
-
270
-
271
-
272
-
273
-
274
-
275
-
276
-
277
-
278
-
279
-
280
-
281
-
282
-
283
-
284
-
285
-
286
-
287
-
288
-
289
-
290
-
291
-
292
-
293
-
294
-
295
-
296
-
297
-
298
-
299
-
300
-
301
-
302
-
303
-
304
-
305
-
306
-
307
-
308
-
309
-
310
-
311
-
312
-
313
-
314
-
315
-
316
-
317
-
318
-
319
-
320
-
321
-
322
-
323
-
324
-
325
-
326
-
327
-
328
-
329
-
330
-
331
-
332
-
333
-
334
-
335
-
336
-
337
-
338
-
339
-
340
-
341
-
342
-
343
-
344
-
345
-
346
-
347
-
348
-
 349
349 -
 350
350 -
 351
351 -
 352
352 -
 353
353 -
 354
354 -
 355
355 -
 356
356 -
 357
357 -
 358
358 -
 359
359 -
 360
360 -
 361
361 -
 362
362 -
 363
363 -
 364
364 -
 365
365 -
 366
366 -
 367
367 -
 368
368 -
 369
369 -
370
-
371
-
372
-
373
-
374
-
375
-
376
-
377
-
378
-
379
-
380
-
381
-
382
-
383
-
384
-
385
-
386
-
387
-
388
-
389
-
390
-
391
-
392
-
393
-
394
-
395
-
396
-
397
-
398
-
399
-
400
-
401
-
402
-
403
-
404
-
405
-
406
-
407
-
408
-
409
-
410
-
411
-
412
-
413
-
414
-
415
-
416
-
417
-
418
-
419
-
420
-
421
-
422
-
423
-
424
-
425
-
426
-
427
-
428
-
429
-
430
-
431
-
432
-
433
-
434
-
435
-
436
-
437
-
438
-
439
-
440
-
441
-
442
-
443
-
444
-
445
 |
 |

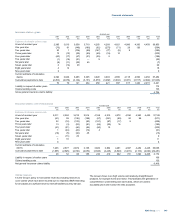
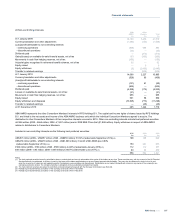
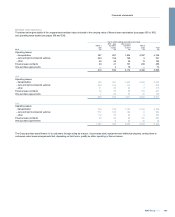
28 Non-controlling interests
ABN
AMRO
Other
interests Total
£m £m £m
At 1 January 2009 16,183 5,436 21,619
Currency translation and other adjustments (1,282) (152) (1,434)
(Loss)/profit attributable to non-controlling interests
- continuing operations (266) 648 382
- discontinued operations (33) — (33)
Dividends paid — (313) (313)
Gains/(losses) on available-for-sale financial assets, net of tax 133 (336) (203)
Movements in cash flow hedging reserves, net of tax (150) — (150)
Actuarial gains recognised in retirement benefit schemes, net of tax 92 — 92
Equity raised — 9 9
Equity withdrawn (9) (2,436) (2,445)
Transfer to retained earnings — (629) (629)
At 1 January 2010 14,668 2,227 16,895
Currency translation and other adjustments (529) 63 (466)
(Loss)/profit attributable to non-controlling interests
- continuing operations (121) 61 (60)
- discontinued operations (605) — (605)
Dividends paid (4,028) (172) (4,200)
Losses on available-for-sale financial assets, net of tax (21) — (21)
Movements in cash flow hedging reserves, net of tax 955 — 955
Equity raised 501 58 559
Equity withdrawn and disposals (10,525) (773) (11,298)
Transfer to retained earnings — (40) (40)
At 31 December 2010 295 1,424 1,719
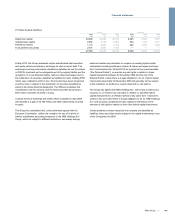
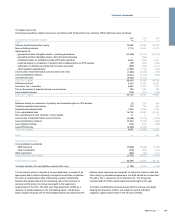
ABN AMRO represents the other Consortium Members' interests in RFS Holdings B.V. The capital and income rights of shares issued by RFS Holdings
B.V. are linked to the net assets and income of the ABN AMRO business units which the individual Consortium Members agreed to acquire. The
distribution to other Consortium Members of their respective interests occurred in 2010. Other non-controlling interests include trust preferred securities
of £556 million (2009 - £664 million; 2008 - £1,821 million) and in 2008 RBS China Sarl (£1,898 million). Equity withdrawn in respect of ABN AMRO
relates to distributions to Consortium Members.
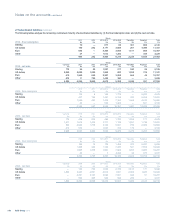
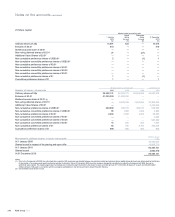
Included in non-controlling interests are the following trust preferred securities:
2010 2009 2008
£m £m £m
US$357 million (2009 - US$357 million; 2008 - US$950 million) 5.512% (redeemable September 2014) (3) 198 198 529
US$276 million (2009 - US$470 million; 2008 - US$1,000 million) 3 month US$ LIBOR plus 0.80%
(redeemable September 2014) (3,4) 153 261 555
€166 million (2009 - €166 million; 2008 - €500 million) 4.243% (redeemable January 2016) (3) 112 112 337
£93 million (2009 - £93 million; 2008 - £400 million) 5.6457% (redeemable June 2017) (3) 93 93 400
556 664 1,821
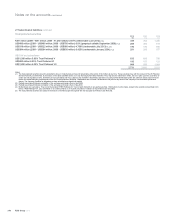
Notes:
(1) The trust preferred securities issued by subsidiaries have no maturity date and are not redeemable at the option of the holders at any time. These securities may, with the consent of the UK Financial
Services Authority, be redeemed, in whole or in part, by the issuer on the dates specified above or on any interest payment date thereafter. They may also be redeemed in whole, but not in part,
upon the occurrence of certain tax and regulatory events. Dividends are non-cumulative and discretionary. Distributions are not made if dividends are not paid on any series of the company’s non-
cumulative preference shares. The company classifies its obligations to these subsidiaries as dated loan capital.
(2) The trust preferred securities are subject to restrictions on dividend payments agreed with the European Commission (see Note 29).
(3) Partially repurchased following completion of the exchange and tender offers in April 2009.
(4) Partially repurchased following completion of the exchange and tender offers in May 2010.
357RBS Group 2010
Financial statements