RBS 2010 Annual Report Download - page 115
Download and view the complete annual report
Please find page 115 of the 2010 RBS annual report below. You can navigate through the pages in the report by either clicking on the pages listed below, or by using the keyword search tool below to find specific information within the annual report.-
 1
1 -
2
-
3
-
4
-
5
-
6
-
7
-
8
-
9
-
10
-
11
-
12
-
13
-
14
-
15
-
16
-
17
-
18
-
19
-
20
-
21
-
22
-
23
-
24
-
25
-
26
-
27
-
28
-
29
-
30
-
31
-
32
-
33
-
34
-
35
-
36
-
37
-
38
-
39
-
40
-
41
-
42
-
43
-
44
-
45
-
46
-
47
-
48
-
49
-
50
-
51
-
52
-
53
-
54
-
55
-
56
-
57
-
58
-
59
-
60
-
61
-
62
-
63
-
64
-
65
-
66
-
67
-
68
-
69
-
70
-
71
-
72
-
73
-
74
-
75
-
76
-
77
-
78
-
79
-
80
-
81
-
82
-
83
-
84
-
85
-
86
-
87
-
88
-
89
-
90
-
91
-
92
-
93
-
94
-
95
-
96
-
97
-
98
-
99
-
100
-
101
-
102
-
103
-
104
-
 105
105 -
 106
106 -
 107
107 -
 108
108 -
 109
109 -
 110
110 -
 111
111 -
 112
112 -
 113
113 -
 114
114 -
 115
115 -
 116
116 -
 117
117 -
 118
118 -
 119
119 -
 120
120 -
 121
121 -
 122
122 -
 123
123 -
 124
124 -
 125
125 -
126
-
127
-
128
-
129
-
130
-
131
-
132
-
133
-
134
-
135
-
136
-
137
-
138
-
139
-
140
-
141
-
142
-
143
-
144
-
145
-
146
-
147
-
148
-
149
-
150
-
151
-
152
-
153
-
154
-
155
-
156
-
157
-
158
-
159
-
160
-
161
-
162
-
163
-
164
-
165
-
166
-
167
-
168
-
169
-
170
-
171
-
172
-
173
-
174
-
175
-
176
-
177
-
178
-
179
-
180
-
181
-
182
-
183
-
184
-
185
-
186
-
187
-
188
-
189
-
190
-
191
-
192
-
193
-
194
-
195
-
196
-
197
-
198
-
199
-
200
-
201
-
202
-
203
-
204
-
205
-
206
-
207
-
208
-
209
-
210
-
211
-
212
-
213
-
214
-
215
-
216
-
217
-
218
-
219
-
220
-
221
-
222
-
223
-
224
-
225
-
226
-
227
-
228
-
229
-
230
-
231
-
232
-
233
-
234
-
235
-
236
-
237
-
238
-
239
-
240
-
241
-
242
-
243
-
244
-
245
-
246
-
247
-
248
-
249
-
250
-
251
-
252
-
253
-
254
-
255
-
256
-
257
-
258
-
259
-
260
-
261
-
262
-
263
-
264
-
265
-
266
-
267
-
268
-
269
-
270
-
271
-
272
-
273
-
274
-
275
-
276
-
277
-
278
-
279
-
280
-
281
-
282
-
283
-
284
-
285
-
286
-
287
-
288
-
289
-
290
-
291
-
292
-
293
-
294
-
295
-
296
-
297
-
298
-
299
-
300
-
301
-
302
-
303
-
304
-
305
-
306
-
307
-
308
-
309
-
310
-
311
-
312
-
313
-
314
-
315
-
316
-
317
-
318
-
319
-
320
-
321
-
322
-
323
-
324
-
325
-
326
-
327
-
328
-
329
-
330
-
331
-
332
-
333
-
334
-
335
-
336
-
337
-
338
-
339
-
340
-
341
-
342
-
343
-
344
-
345
-
346
-
347
-
348
-
349
-
350
-
351
-
352
-
353
-
354
-
355
-
356
-
357
-
358
-
359
-
360
-
361
-
362
-
363
-
364
-
365
-
366
-
367
-
368
-
369
-
370
-
371
-
372
-
373
-
374
-
375
-
376
-
377
-
378
-
379
-
380
-
381
-
382
-
383
-
384
-
385
-
386
-
387
-
388
-
389
-
390
-
391
-
392
-
393
-
394
-
395
-
396
-
397
-
398
-
399
-
400
-
401
-
402
-
403
-
404
-
405
-
406
-
407
-
408
-
409
-
410
-
411
-
412
-
413
-
414
-
415
-
416
-
417
-
418
-
419
-
420
-
421
-
422
-
423
-
424
-
425
-
426
-
427
-
428
-
429
-
430
-
431
-
432
-
433
-
434
-
435
-
436
-
437
-
438
-
439
-
440
-
441
-
442
-
443
-
444
-
445
 |
 |

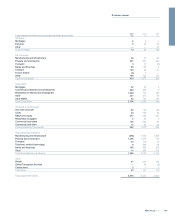
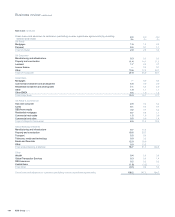
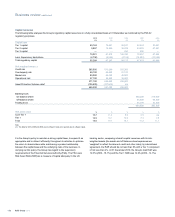
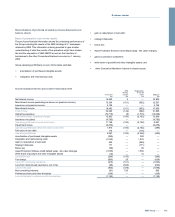
Reconciliations of pro forma to statutory income statements and
balance sheets
Basis of preparation of pro forma results
The pro forma financial information shows the underlying performance of
the Group including the results of the RBS Holdings N.V. businesses
retained by RBS. This information is being provided to give a better
understanding of what the results of the operations might have looked
like had the acquisition of ABN AMRO as well as the transfers of
businesses to the other Consortium Members occurred on 1 January
2008.
Group operating profit/(loss) on a pro forma basis excludes:
xamortisation of purchased intangible assets;
xintegration and restructuring costs;
xgain on redemption of own debt;
xstrategic disposals;
xbonus tax;
xAsset Protection Scheme credit default swap - fair value changes;
xgains on pensions curtailment;
xwrite-down of goodwill and other intangible assets; and
xother Consortium Members’ interest in shared assets.
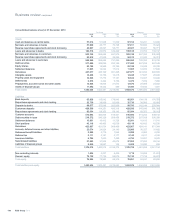
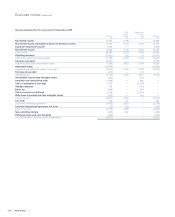
Income statement for the year ended 31 December 2010
RFS Reallocation
minority of one-off
Pro forma interest items Statutory
£m £m £m £m
Net interest income 14,200 9 — 14,209
Non-interest income (excluding insurance net premium income) 13,334 (151) (652) 12,531
Insurance net premium income 5,128 — — 5,128
Non-interest income 18,462 (151) (652) 17,659
Total income 32,662 (142) (652) 31,868
Operating expenses (16,710) (8) (1,510) (18,228)
Profit before other operating charges 15,952 (150) (2,162) 13,640
Insurance net claims (4,783) — — (4,783)
Operating profit before impairment losses 11,169 (150) (2,162) 8,857
Impairment losses (9,256) — — (9,256)
Operating profit/(loss) before fair value of own debt 1,913 (150) (2,162) (399)
Fair value of own debt 174 — (174) —
Operating profit/(loss) 2,087 (150) (2,336) (399)
Amortisation of purchased intangible assets (369) — 369 —
Integration and restructuring costs (1,032) — 1,032 —
Gain on redemption of own debt 553 — (553) —
Strategic disposals 171 — (171) —
Bonus tax (99) — 99 —
Asset Protection Scheme credit default swap - fair value changes (1,550) — 1,550 —
Write-down of goodwill and other intangible assets (10) — 10 —
Loss before tax (249) (150) — (399)
Tax charge (663) 29 — (634)
Loss from continuing operations (912) (121) — (1,033)
Loss from discontinued operations, net of tax (28) (605) — (633)
Loss for the year (940) (726) — (1,666)
Non-controlling interests (61) 726 — 665
Preference share and other dividends (124) — — (124)
Loss attributable to ordinary and B shareholders (1,125) — — (1,125)
113RBS Group 2010
Business review