RBS 2010 Annual Report Download - page 180
Download and view the complete annual report
Please find page 180 of the 2010 RBS annual report below. You can navigate through the pages in the report by either clicking on the pages listed below, or by using the keyword search tool below to find specific information within the annual report.-
 1
1 -
2
-
3
-
4
-
5
-
6
-
7
-
8
-
9
-
10
-
11
-
12
-
13
-
14
-
15
-
16
-
17
-
18
-
19
-
20
-
21
-
22
-
23
-
24
-
25
-
26
-
27
-
28
-
29
-
30
-
31
-
32
-
33
-
34
-
35
-
36
-
37
-
38
-
39
-
40
-
41
-
42
-
43
-
44
-
45
-
46
-
47
-
48
-
49
-
50
-
51
-
52
-
53
-
54
-
55
-
56
-
57
-
58
-
59
-
60
-
61
-
62
-
63
-
64
-
65
-
66
-
67
-
68
-
69
-
70
-
71
-
72
-
73
-
74
-
75
-
76
-
77
-
78
-
79
-
80
-
81
-
82
-
83
-
84
-
85
-
86
-
87
-
88
-
89
-
90
-
91
-
92
-
93
-
94
-
95
-
96
-
97
-
98
-
99
-
100
-
101
-
102
-
103
-
104
-
105
-
106
-
107
-
108
-
109
-
110
-
111
-
112
-
113
-
114
-
115
-
116
-
117
-
118
-
119
-
120
-
121
-
122
-
123
-
124
-
125
-
126
-
127
-
128
-
129
-
130
-
131
-
132
-
133
-
134
-
135
-
136
-
137
-
138
-
139
-
140
-
141
-
142
-
143
-
144
-
145
-
146
-
147
-
148
-
149
-
150
-
151
-
152
-
153
-
154
-
155
-
156
-
157
-
158
-
159
-
160
-
161
-
162
-
163
-
164
-
165
-
166
-
167
-
168
-
169
-
 170
170 -
 171
171 -
 172
172 -
 173
173 -
 174
174 -
 175
175 -
 176
176 -
 177
177 -
 178
178 -
 179
179 -
 180
180 -
 181
181 -
 182
182 -
 183
183 -
 184
184 -
 185
185 -
 186
186 -
 187
187 -
 188
188 -
 189
189 -
 190
190 -
191
-
192
-
193
-
194
-
195
-
196
-
197
-
198
-
199
-
200
-
201
-
202
-
203
-
204
-
205
-
206
-
207
-
208
-
209
-
210
-
211
-
212
-
213
-
214
-
215
-
216
-
217
-
218
-
219
-
220
-
221
-
222
-
223
-
224
-
225
-
226
-
227
-
228
-
229
-
230
-
231
-
232
-
233
-
234
-
235
-
236
-
237
-
238
-
239
-
240
-
241
-
242
-
243
-
244
-
245
-
246
-
247
-
248
-
249
-
250
-
251
-
252
-
253
-
254
-
255
-
256
-
257
-
258
-
259
-
260
-
261
-
262
-
263
-
264
-
265
-
266
-
267
-
268
-
269
-
270
-
271
-
272
-
273
-
274
-
275
-
276
-
277
-
278
-
279
-
280
-
281
-
282
-
283
-
284
-
285
-
286
-
287
-
288
-
289
-
290
-
291
-
292
-
293
-
294
-
295
-
296
-
297
-
298
-
299
-
300
-
301
-
302
-
303
-
304
-
305
-
306
-
307
-
308
-
309
-
310
-
311
-
312
-
313
-
314
-
315
-
316
-
317
-
318
-
319
-
320
-
321
-
322
-
323
-
324
-
325
-
326
-
327
-
328
-
329
-
330
-
331
-
332
-
333
-
334
-
335
-
336
-
337
-
338
-
339
-
340
-
341
-
342
-
343
-
344
-
345
-
346
-
347
-
348
-
349
-
350
-
351
-
352
-
353
-
354
-
355
-
356
-
357
-
358
-
359
-
360
-
361
-
362
-
363
-
364
-
365
-
366
-
367
-
368
-
369
-
370
-
371
-
372
-
373
-
374
-
375
-
376
-
377
-
378
-
379
-
380
-
381
-
382
-
383
-
384
-
385
-
386
-
387
-
388
-
389
-
390
-
391
-
392
-
393
-
394
-
395
-
396
-
397
-
398
-
399
-
400
-
401
-
402
-
403
-
404
-
405
-
406
-
407
-
408
-
409
-
410
-
411
-
412
-
413
-
414
-
415
-
416
-
417
-
418
-
419
-
420
-
421
-
422
-
423
-
424
-
425
-
426
-
427
-
428
-
429
-
430
-
431
-
432
-
433
-
434
-
435
-
436
-
437
-
438
-
439
-
440
-
441
-
442
-
443
-
444
-
445
 |
 |

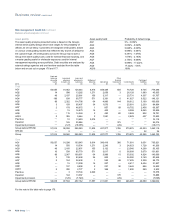
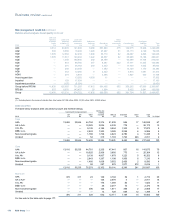
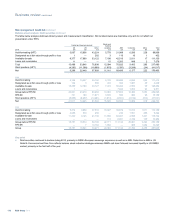
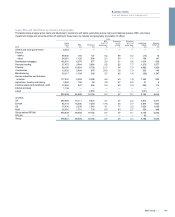
Risk management: Credit risk continued
Balance sheet analysis: Debt securities continued
The table below analyses debt securities by issuer and measurement classification. Net numbers below are illustrative only and do not reflect net
presentation under IFRS.
Central and local government
UK US Other
Banks and
building
societies ABS Corporate Other Total
2010 £m £m £m £m £m £m £m £m
Held-for-trading (HFT) 5,097 15,956 43,224 5,778 21,988 6,590 236 98,869
Designated as at fair value through profit or loss 1 — 262 3 119 16 1 402
Available-for-sale 8,377 17,890 33,122 7,198 42,515 2,011 17 111,130
Loans and receivables 11 — — 15 6,203 848 2 7,079
Total 13,486 33,846 76,608 12,994 70,825 9,465 256 217,480
Short positions (HFT) (4,200) (11,398) (18,909) (1,853) (1,335) (3,288) (34) (41,017)
Net 9,286 22,448 57,699 11,141 69,490 6,177 222 176,463
2009
Held-for-trading 8,128 10,427 50,150 6,103 28,820 6,892 893 111,413
Designated as at fair value through profit or loss 122 3 385 418 394 1,087 20 2,429
Available-for-sale 18,350 12,789 33,727 7,472 50,464 2,550 30 125,382
Loans and receivables 1 — — — 7,924 1,853 93 9,871
Group before RFS MI 26,601 23,219 84,262 13,993 87,602 12,382 1,036 249,095
RFS MI 721 183 11,871 3,803 580 906 95 18,159
Short positions (HFT) (5,805) (8,957) (14,491) (1,951) (3,616) (2,199) (512) (37,531)
Net 21,517 14,445 81,642 15,845 84,566 11,089 619 229,723
2008
Held-for-trading 5,372 9,859 37,518 10,947 39,879 11,013 1,571 116,159
Designated as at fair value through profit or loss 2,085 510 456 — 236 1,551 456 5,294
Available-for-sale 11,330 6,145 21,735 11,650 62,067 4,588 1,207 118,722
Loans and receivables — — — 114 8,961 3,749 160 12,984
Group before RFS MI 18,787 16,514 59,709 22,711 111,143 20,901 3,394 253,159
RFS MI — 7 10,762 1,652 — 885 1,084 14,390
Group 18,787 16,521 70,471 24,363 111,143 21,786 4,478 267,549
Key point
xDebt securities continued to decline during 2010, primarily in GBM’s European sovereign exposures as well as in ABS. Reduction in ABS in US
Retail & Commercial and Non-Core reflects balance sheet reduction strategies whereas GBM’s sell down followed increased liquidity in US RMBS
market, primarily in the first half of the year.
RBS Group 2010178
Business review continued