RBS 2010 Annual Report Download - page 331
Download and view the complete annual report
Please find page 331 of the 2010 RBS annual report below. You can navigate through the pages in the report by either clicking on the pages listed below, or by using the keyword search tool below to find specific information within the annual report.-
 1
1 -
2
-
3
-
4
-
5
-
6
-
7
-
8
-
9
-
10
-
11
-
12
-
13
-
14
-
15
-
16
-
17
-
18
-
19
-
20
-
21
-
22
-
23
-
24
-
25
-
26
-
27
-
28
-
29
-
30
-
31
-
32
-
33
-
34
-
35
-
36
-
37
-
38
-
39
-
40
-
41
-
42
-
43
-
44
-
45
-
46
-
47
-
48
-
49
-
50
-
51
-
52
-
53
-
54
-
55
-
56
-
57
-
58
-
59
-
60
-
61
-
62
-
63
-
64
-
65
-
66
-
67
-
68
-
69
-
70
-
71
-
72
-
73
-
74
-
75
-
76
-
77
-
78
-
79
-
80
-
81
-
82
-
83
-
84
-
85
-
86
-
87
-
88
-
89
-
90
-
91
-
92
-
93
-
94
-
95
-
96
-
97
-
98
-
99
-
100
-
101
-
102
-
103
-
104
-
105
-
106
-
107
-
108
-
109
-
110
-
111
-
112
-
113
-
114
-
115
-
116
-
117
-
118
-
119
-
120
-
121
-
122
-
123
-
124
-
125
-
126
-
127
-
128
-
129
-
130
-
131
-
132
-
133
-
134
-
135
-
136
-
137
-
138
-
139
-
140
-
141
-
142
-
143
-
144
-
145
-
146
-
147
-
148
-
149
-
150
-
151
-
152
-
153
-
154
-
155
-
156
-
157
-
158
-
159
-
160
-
161
-
162
-
163
-
164
-
165
-
166
-
167
-
168
-
169
-
170
-
171
-
172
-
173
-
174
-
175
-
176
-
177
-
178
-
179
-
180
-
181
-
182
-
183
-
184
-
185
-
186
-
187
-
188
-
189
-
190
-
191
-
192
-
193
-
194
-
195
-
196
-
197
-
198
-
199
-
200
-
201
-
202
-
203
-
204
-
205
-
206
-
207
-
208
-
209
-
210
-
211
-
212
-
213
-
214
-
215
-
216
-
217
-
218
-
219
-
220
-
221
-
222
-
223
-
224
-
225
-
226
-
227
-
228
-
229
-
230
-
231
-
232
-
233
-
234
-
235
-
236
-
237
-
238
-
239
-
240
-
241
-
242
-
243
-
244
-
245
-
246
-
247
-
248
-
249
-
250
-
251
-
252
-
253
-
254
-
255
-
256
-
257
-
258
-
259
-
260
-
261
-
262
-
263
-
264
-
265
-
266
-
267
-
268
-
269
-
270
-
271
-
272
-
273
-
274
-
275
-
276
-
277
-
278
-
279
-
280
-
281
-
282
-
283
-
284
-
285
-
286
-
287
-
288
-
289
-
290
-
291
-
292
-
293
-
294
-
295
-
296
-
297
-
298
-
299
-
300
-
301
-
302
-
303
-
304
-
305
-
306
-
307
-
308
-
309
-
310
-
311
-
312
-
313
-
314
-
315
-
316
-
317
-
318
-
319
-
320
-
 321
321 -
 322
322 -
 323
323 -
 324
324 -
 325
325 -
 326
326 -
 327
327 -
 328
328 -
 329
329 -
 330
330 -
 331
331 -
 332
332 -
 333
333 -
 334
334 -
 335
335 -
 336
336 -
 337
337 -
 338
338 -
 339
339 -
 340
340 -
 341
341 -
342
-
343
-
344
-
345
-
346
-
347
-
348
-
349
-
350
-
351
-
352
-
353
-
354
-
355
-
356
-
357
-
358
-
359
-
360
-
361
-
362
-
363
-
364
-
365
-
366
-
367
-
368
-
369
-
370
-
371
-
372
-
373
-
374
-
375
-
376
-
377
-
378
-
379
-
380
-
381
-
382
-
383
-
384
-
385
-
386
-
387
-
388
-
389
-
390
-
391
-
392
-
393
-
394
-
395
-
396
-
397
-
398
-
399
-
400
-
401
-
402
-
403
-
404
-
405
-
406
-
407
-
408
-
409
-
410
-
411
-
412
-
413
-
414
-
415
-
416
-
417
-
418
-
419
-
420
-
421
-
422
-
423
-
424
-
425
-
426
-
427
-
428
-
429
-
430
-
431
-
432
-
433
-
434
-
435
-
436
-
437
-
438
-
439
-
440
-
441
-
442
-
443
-
444
-
445
 |
 |

.
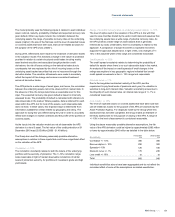
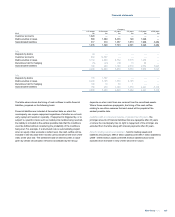
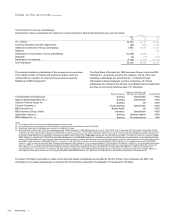
The Group holds collateral in respect of certain loans and advances to
banks and customers that are past due or impaired. Such collateral
includes mortgages over property (both personal and commercial);
charges over business assets such as plant, inventories and trade
debtors; and guarantees of lending from parties other than the borrower.
The following table shows financial and non-financial assets, recognised
on the Group's balance sheet, obtained during the year by taking
possession of collateral or calling on other credit enhancements.
Group
2010 2009 2008
£m £m £m
Residential property 47 52 41
Other property 139 110 6
Cash 127 283 59
Other assets 28 42 30
341 487 136
In general, the Group seeks to dispose of property and other assets not readily convertible into cash, obtained by taking possession of collateral, as
rapidly as the market for the individual asset permits.
Loans that have been renegotiated in the past 12 months that would otherwise have been past due or impaired amounted to £5,758 million at 31
December 2010 (2009 - £2,698 million; 2008 - £2,637 million).
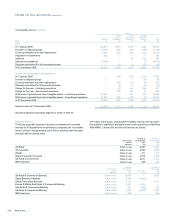
15 Derivatives
Companies in the Group transact derivatives as principal either as a
trading activity or to manage balance sheet foreign exchange, interest
rate and credit risk.
The Group enters into fair value hedges, cash flow hedges and hedges of
net investments in foreign operations. The majority of the Group's interest
rate hedges relate to the management of the Group's non-trading interest
rate risk. The Group manages this risk within approved limits. Residual
risk positions are hedged with derivatives principally interest rate swaps.
Suitable larger ticket financial instruments are fair value hedged; the
remaining exposure, where possible, is hedged by derivatives
documented as cash flow hedges and qualifying for hedge accounting.
The majority of the Group's fair value hedges involve interest rate swaps
hedging the interest rate risk in recognised financial assets and financial
liabilities. Cash flow hedges relate to exposures to the variability in future
interest payments and receipts on forecast transactions and on
recognised financial assets and financial liabilities. The Group hedges its
net investments in foreign operations with currency borrowings and
forward foreign exchange contracts.
For cash flow hedge relationships of interest rate risk, the hedged items
are actual and forecast variable interest rate cash flows arising from
financial assets and financial liabilities with interest rates linked to LIBOR,
EURIBOR or the Bank of England Official Bank Rate. The financial
assets are customer loans and the financial liabilities are customer
deposits and LIBOR linked medium-term notes and other issued
securities. As at 31 December 2010, variable rate financial assets of
£41.7 billion and variable rate financial liabilities of £11.4 billion were
hedged in such cash flow hedge relationships.
For cash flow hedging relationships, the initial and ongoing prospective
effectiveness is assessed by comparing movements in the fair value of
the expected highly probable forecast interest cash flows with
movements in the fair value of the expected changes in cash flows from
the hedging interest rate swap or by comparing the respective changes in
the price value of a basis point. Prospective effectiveness is measured on
acumulative basis i.e. over the entire life of the hedge relationship. The
method of calculating hedge ineffectiveness is the hypothetical derivative
method. Retrospective effectiveness is assessed by comparing the actual
movements in the fair value of the cash flows and actual movements in
the fair value of the hedged cash flows from the interest rate swap over
the life to date of the hedging relationship.
For fair value hedge relationships of interest rate risk, the hedged items
are typically large corporate fixed-rate loans, fixed rate finance leases,
fixed rate medium-term notes or preference shares classified as debt. At
31 December 2010, fixed rate financial assets of £48.8 billion and fixed
rate financial liabilities of £63.9 billion were hedged by interest rate swaps
in fair value hedge relationships.
The initial and ongoing prospective effectiveness of fair value hedge
relationships is assessed on a cumulative basis by comparing
movements in the fair value of the hedged item attributable to the hedged
risk with changes in the fair value of the hedging interest rate swap or by
comparing the respective changes in the price value of a basis point.
Retrospective effectiveness is assessed by comparing the actual
movements in the fair value of the hedged items attributable to the
hedged risk with actual movements in the fair value of the hedging
derivative over the life to date of the hedging relationship.
329RBS Group 2010
Financial statements