RBS 2010 Annual Report Download - page 9
Download and view the complete annual report
Please find page 9 of the 2010 RBS annual report below. You can navigate through the pages in the report by either clicking on the pages listed below, or by using the keyword search tool below to find specific information within the annual report.-
 1
1 -
 2
2 -
 3
3 -
 4
4 -
 5
5 -
 6
6 -
 7
7 -
 8
8 -
 9
9 -
 10
10 -
 11
11 -
 12
12 -
 13
13 -
 14
14 -
 15
15 -
 16
16 -
 17
17 -
 18
18 -
 19
19 -
 20
20 -
21
-
22
-
23
-
24
-
25
-
26
-
27
-
28
-
29
-
30
-
31
-
32
-
33
-
34
-
35
-
36
-
37
-
38
-
39
-
40
-
41
-
42
-
43
-
44
-
45
-
46
-
47
-
48
-
49
-
50
-
51
-
52
-
53
-
54
-
55
-
56
-
57
-
58
-
59
-
60
-
61
-
62
-
63
-
64
-
65
-
66
-
67
-
68
-
69
-
70
-
71
-
72
-
73
-
74
-
75
-
76
-
77
-
78
-
79
-
80
-
81
-
82
-
83
-
84
-
85
-
86
-
87
-
88
-
89
-
90
-
91
-
92
-
93
-
94
-
95
-
96
-
97
-
98
-
99
-
100
-
101
-
102
-
103
-
104
-
105
-
106
-
107
-
108
-
109
-
110
-
111
-
112
-
113
-
114
-
115
-
116
-
117
-
118
-
119
-
120
-
121
-
122
-
123
-
124
-
125
-
126
-
127
-
128
-
129
-
130
-
131
-
132
-
133
-
134
-
135
-
136
-
137
-
138
-
139
-
140
-
141
-
142
-
143
-
144
-
145
-
146
-
147
-
148
-
149
-
150
-
151
-
152
-
153
-
154
-
155
-
156
-
157
-
158
-
159
-
160
-
161
-
162
-
163
-
164
-
165
-
166
-
167
-
168
-
169
-
170
-
171
-
172
-
173
-
174
-
175
-
176
-
177
-
178
-
179
-
180
-
181
-
182
-
183
-
184
-
185
-
186
-
187
-
188
-
189
-
190
-
191
-
192
-
193
-
194
-
195
-
196
-
197
-
198
-
199
-
200
-
201
-
202
-
203
-
204
-
205
-
206
-
207
-
208
-
209
-
210
-
211
-
212
-
213
-
214
-
215
-
216
-
217
-
218
-
219
-
220
-
221
-
222
-
223
-
224
-
225
-
226
-
227
-
228
-
229
-
230
-
231
-
232
-
233
-
234
-
235
-
236
-
237
-
238
-
239
-
240
-
241
-
242
-
243
-
244
-
245
-
246
-
247
-
248
-
249
-
250
-
251
-
252
-
253
-
254
-
255
-
256
-
257
-
258
-
259
-
260
-
261
-
262
-
263
-
264
-
265
-
266
-
267
-
268
-
269
-
270
-
271
-
272
-
273
-
274
-
275
-
276
-
277
-
278
-
279
-
280
-
281
-
282
-
283
-
284
-
285
-
286
-
287
-
288
-
289
-
290
-
291
-
292
-
293
-
294
-
295
-
296
-
297
-
298
-
299
-
300
-
301
-
302
-
303
-
304
-
305
-
306
-
307
-
308
-
309
-
310
-
311
-
312
-
313
-
314
-
315
-
316
-
317
-
318
-
319
-
320
-
321
-
322
-
323
-
324
-
325
-
326
-
327
-
328
-
329
-
330
-
331
-
332
-
333
-
334
-
335
-
336
-
337
-
338
-
339
-
340
-
341
-
342
-
343
-
344
-
345
-
346
-
347
-
348
-
349
-
350
-
351
-
352
-
353
-
354
-
355
-
356
-
357
-
358
-
359
-
360
-
361
-
362
-
363
-
364
-
365
-
366
-
367
-
368
-
369
-
370
-
371
-
372
-
373
-
374
-
375
-
376
-
377
-
378
-
379
-
380
-
381
-
382
-
383
-
384
-
385
-
386
-
387
-
388
-
389
-
390
-
391
-
392
-
393
-
394
-
395
-
396
-
397
-
398
-
399
-
400
-
401
-
402
-
403
-
404
-
405
-
406
-
407
-
408
-
409
-
410
-
411
-
412
-
413
-
414
-
415
-
416
-
417
-
418
-
419
-
420
-
421
-
422
-
423
-
424
-
425
-
426
-
427
-
428
-
429
-
430
-
431
-
432
-
433
-
434
-
435
-
436
-
437
-
438
-
439
-
440
-
441
-
442
-
443
-
444
-
445
 |
 |
7RBS Group 2010
Essential reading
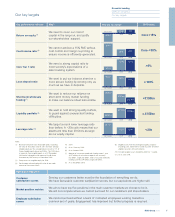
Q&As on progress
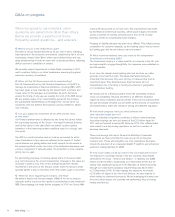
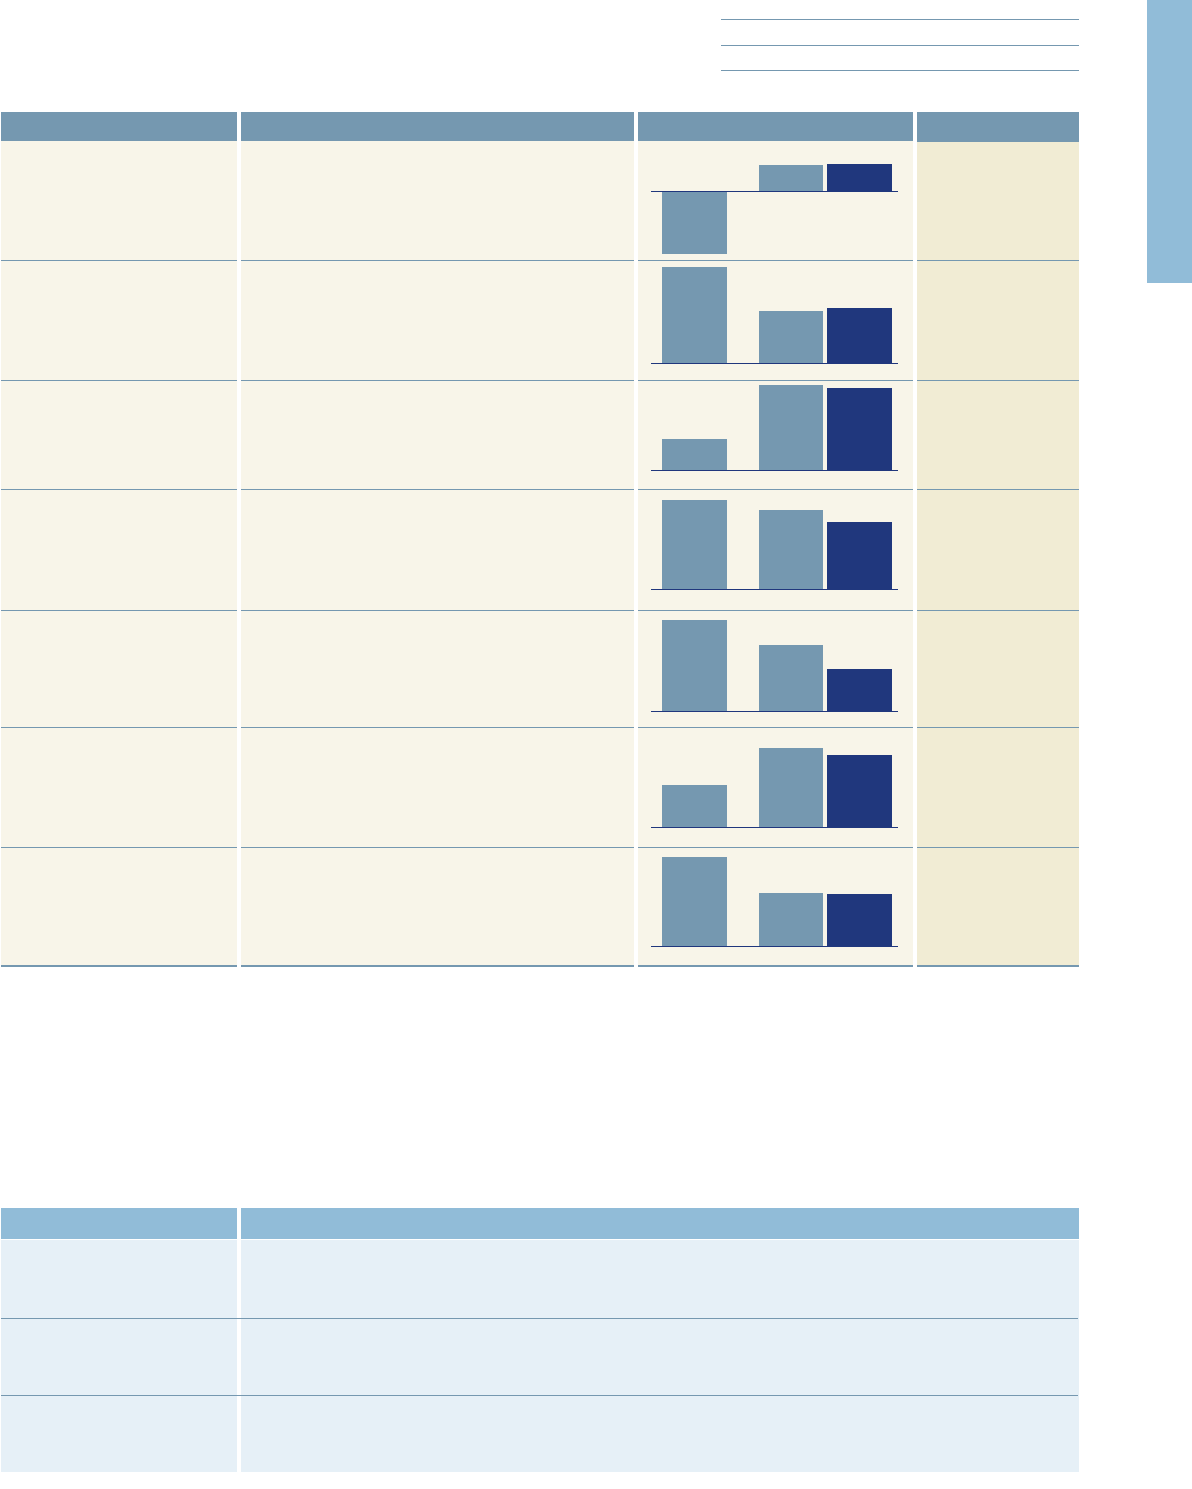
Our key targets
Why?
We need to cover our cost of
capital in the long-run, and justify
our shareholders’ support.
We cannot achieve a 15% RoE without
cost control and margin re-pricing to
ensure income is efficiently generated.
We need a strong capital ratio to
meet society’s expectations of a
safer banking system.
We want to put our balance sheet on a
more secure footing by lending only as
much as we have in deposits.
We want to reduce our reliance on
short-term money market funding
to make our balance sheet less volatile.
We want to hold strong liquidity buffers,
to guard against unexpected funding
difficulties.
We target a much lower leverage ratio
than before. A <20x ratio means that our
assets are less than 20 times as large
as our equity capital.
2013 target
Core >15%
Core <50%
>8%
c.100%
<£150bn
c.£150bn
<20x
Key performance indicator
Return on equity (1)
Cost:income ratio (3)
Core Tier 1 ratio
Loan:deposit ratio
Short-term wholesale
funding (7)
Liquidity portfolio (9)
Leverage ratio (10)
Our key targets
How are we doing?
10.7%
11.0%
4%(5)
worst point 2009 2010
117%
135%
154%(6)
worst point 2009 2010
£157bn
£250bn
£343bn(8)
worst point 2009 2010
£155bn
£171bn
£90bn(8)
worst point 2009 2010
16.9x
17.0x
28.7x(11)
worst point 2009 2010
13%13%
(31%)(2)
worst point
2009 2010
56%
53%
97%(4)
worst point 2009 2010
Operational Objectives
Customer
satisfaction scores
Market position metrics
Employee satisfaction
scores
Serving our customers better must be the foundation of everything we do.
We have favourable customer satisfaction scores, but our aspirations are higher still.
We aim to have top five positions in the main customer markets we choose to be in.
We will not compete where we cannot succeed for our customers and shareholders.
We cannot succeed without a team of motivated employees working towards a
common set of goals. Engagement has improved but further progress is required.
Notes:
(1) Based on indicative Core attributable profit, excluding
fair value of own debt, taxed at 28% and Core average
tangible equity per the average balance sheet (c.70% of
Group tangible equity based on RWAs). The 2009 return
is based on Core tangible equity as at 31 December
2009 which included the full amount of the B Share
investment by HM Treasury in December 2009.
(2) Group return on tangible equity for 2008.
(3) Cost:income ratio excluding fair value of own debt
and net of insurance claims.
(4) 2008.
(5) As at 1 January 2008.
(6) As at October 2008.
(7) Amount of unsecured wholesale funding under 1 year
(£157 billion) of which bank deposits are currently
£63 billion, target £65 billion, other unsecured wholesale
funding currently £94 billion, target £85 billion.
(8) As at December 2008.
(9) Eligible assets held for contingent liquidity purposes
including cash, Government issued securities and other
eligible securities with central banks.
(10) Funded tangible assets divided by total Tier 1 capital.
(11) As at June 2008.