RBS 2010 Annual Report Download - page 103
Download and view the complete annual report
Please find page 103 of the 2010 RBS annual report below. You can navigate through the pages in the report by either clicking on the pages listed below, or by using the keyword search tool below to find specific information within the annual report.-
 1
1 -
2
-
3
-
4
-
5
-
6
-
7
-
8
-
9
-
10
-
11
-
12
-
13
-
14
-
15
-
16
-
17
-
18
-
19
-
20
-
21
-
22
-
23
-
24
-
25
-
26
-
27
-
28
-
29
-
30
-
31
-
32
-
33
-
34
-
35
-
36
-
37
-
38
-
39
-
40
-
41
-
42
-
43
-
44
-
45
-
46
-
47
-
48
-
49
-
50
-
51
-
52
-
53
-
54
-
55
-
56
-
57
-
58
-
59
-
60
-
61
-
62
-
63
-
64
-
65
-
66
-
67
-
68
-
69
-
70
-
71
-
72
-
73
-
74
-
75
-
76
-
77
-
78
-
79
-
80
-
81
-
82
-
83
-
84
-
85
-
86
-
87
-
88
-
89
-
90
-
91
-
92
-
 93
93 -
 94
94 -
 95
95 -
 96
96 -
 97
97 -
 98
98 -
 99
99 -
 100
100 -
 101
101 -
 102
102 -
 103
103 -
 104
104 -
 105
105 -
 106
106 -
 107
107 -
 108
108 -
 109
109 -
 110
110 -
 111
111 -
 112
112 -
 113
113 -
114
-
115
-
116
-
117
-
118
-
119
-
120
-
121
-
122
-
123
-
124
-
125
-
126
-
127
-
128
-
129
-
130
-
131
-
132
-
133
-
134
-
135
-
136
-
137
-
138
-
139
-
140
-
141
-
142
-
143
-
144
-
145
-
146
-
147
-
148
-
149
-
150
-
151
-
152
-
153
-
154
-
155
-
156
-
157
-
158
-
159
-
160
-
161
-
162
-
163
-
164
-
165
-
166
-
167
-
168
-
169
-
170
-
171
-
172
-
173
-
174
-
175
-
176
-
177
-
178
-
179
-
180
-
181
-
182
-
183
-
184
-
185
-
186
-
187
-
188
-
189
-
190
-
191
-
192
-
193
-
194
-
195
-
196
-
197
-
198
-
199
-
200
-
201
-
202
-
203
-
204
-
205
-
206
-
207
-
208
-
209
-
210
-
211
-
212
-
213
-
214
-
215
-
216
-
217
-
218
-
219
-
220
-
221
-
222
-
223
-
224
-
225
-
226
-
227
-
228
-
229
-
230
-
231
-
232
-
233
-
234
-
235
-
236
-
237
-
238
-
239
-
240
-
241
-
242
-
243
-
244
-
245
-
246
-
247
-
248
-
249
-
250
-
251
-
252
-
253
-
254
-
255
-
256
-
257
-
258
-
259
-
260
-
261
-
262
-
263
-
264
-
265
-
266
-
267
-
268
-
269
-
270
-
271
-
272
-
273
-
274
-
275
-
276
-
277
-
278
-
279
-
280
-
281
-
282
-
283
-
284
-
285
-
286
-
287
-
288
-
289
-
290
-
291
-
292
-
293
-
294
-
295
-
296
-
297
-
298
-
299
-
300
-
301
-
302
-
303
-
304
-
305
-
306
-
307
-
308
-
309
-
310
-
311
-
312
-
313
-
314
-
315
-
316
-
317
-
318
-
319
-
320
-
321
-
322
-
323
-
324
-
325
-
326
-
327
-
328
-
329
-
330
-
331
-
332
-
333
-
334
-
335
-
336
-
337
-
338
-
339
-
340
-
341
-
342
-
343
-
344
-
345
-
346
-
347
-
348
-
349
-
350
-
351
-
352
-
353
-
354
-
355
-
356
-
357
-
358
-
359
-
360
-
361
-
362
-
363
-
364
-
365
-
366
-
367
-
368
-
369
-
370
-
371
-
372
-
373
-
374
-
375
-
376
-
377
-
378
-
379
-
380
-
381
-
382
-
383
-
384
-
385
-
386
-
387
-
388
-
389
-
390
-
391
-
392
-
393
-
394
-
395
-
396
-
397
-
398
-
399
-
400
-
401
-
402
-
403
-
404
-
405
-
406
-
407
-
408
-
409
-
410
-
411
-
412
-
413
-
414
-
415
-
416
-
417
-
418
-
419
-
420
-
421
-
422
-
423
-
424
-
425
-
426
-
427
-
428
-
429
-
430
-
431
-
432
-
433
-
434
-
435
-
436
-
437
-
438
-
439
-
440
-
441
-
442
-
443
-
444
-
445
 |
 |

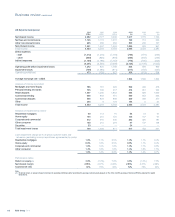
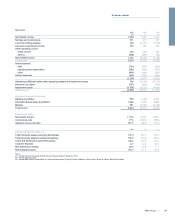
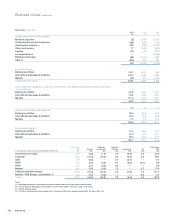
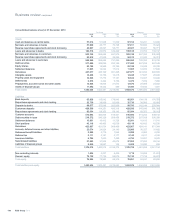
Non-Core
2010 2009 2008
£m £m £m
Net interest income 1,959 1,534 2,156
Net fees and commissions 471 510 912
Loss from trading activities (31) (5,161) (7,739)
Insurance net premium income 702 784 986
Other operating income
-rental income 752 690 682
- other (1) (820) (658) (29)
Non-interest income 1,074 (3,835) (5,188)
Total income 3,033 (2,301) (3,032)
Direct expenses
- staff (731) (851) (988)
- operating lease depreciation (452) (402) (475)
- other (642) (642) (681)
Indirect expenses (500) (552) (539)
(2,325) (2,447) (2,683)
Operating profit/(loss) before other operating charges and impairment losses 708 (4,748) (5,715)
Insurance net claims (737) (588) (700)
Impairment losses (5,476) (9,221) (4,936)
Operating loss (5,505) (14,557) (11,351)
Analysis of income by business
Banking & portfolios 550 (1,338) 2,324
International businesses & portfolios 1,922 2,262 2,980
Markets 561 (3,225) (8,336)
Total income 3,033 (2,301) (3,032)
Performance ratios
Net interest margin 1.16% 0.69% 0.87%
Cost:income ratio 77% (106%) (88%)
Adjusted cost:income ratio 101% (85%) (72%)
£bn £bn £bn
Capital and balance sheet (2,3)
Total third party assets (excluding derivatives) 137.9 201.0 257.9
Total third party assets (including derivatives) 153.9 220.9 342.9
Loans and advances to customers (gross) 108.4 149.5 191.4
Customer deposits 6.7 12.6 27.4
Risk elements in lending 23.4 22.9 11.1
Risk-weighted assets 153.7 171.3 170.9
Notes:
(1) Includes losses on disposals of £504 million for the year ended 31 December 2010.
(2) Includes disposal groups.
(3) Includes RBS Sempra Commodities JV: 2010 third party assets (TPAs) £6.7 billion; RWAs £4.3 billion (2009 TPAs £14.2 billion; RWAs £10.2 billion).
101RBS Group 2010
Business review