RBS 2010 Annual Report Download - page 293
Download and view the complete annual report
Please find page 293 of the 2010 RBS annual report below. You can navigate through the pages in the report by either clicking on the pages listed below, or by using the keyword search tool below to find specific information within the annual report.-
 1
1 -
2
-
3
-
4
-
5
-
6
-
7
-
8
-
9
-
10
-
11
-
12
-
13
-
14
-
15
-
16
-
17
-
18
-
19
-
20
-
21
-
22
-
23
-
24
-
25
-
26
-
27
-
28
-
29
-
30
-
31
-
32
-
33
-
34
-
35
-
36
-
37
-
38
-
39
-
40
-
41
-
42
-
43
-
44
-
45
-
46
-
47
-
48
-
49
-
50
-
51
-
52
-
53
-
54
-
55
-
56
-
57
-
58
-
59
-
60
-
61
-
62
-
63
-
64
-
65
-
66
-
67
-
68
-
69
-
70
-
71
-
72
-
73
-
74
-
75
-
76
-
77
-
78
-
79
-
80
-
81
-
82
-
83
-
84
-
85
-
86
-
87
-
88
-
89
-
90
-
91
-
92
-
93
-
94
-
95
-
96
-
97
-
98
-
99
-
100
-
101
-
102
-
103
-
104
-
105
-
106
-
107
-
108
-
109
-
110
-
111
-
112
-
113
-
114
-
115
-
116
-
117
-
118
-
119
-
120
-
121
-
122
-
123
-
124
-
125
-
126
-
127
-
128
-
129
-
130
-
131
-
132
-
133
-
134
-
135
-
136
-
137
-
138
-
139
-
140
-
141
-
142
-
143
-
144
-
145
-
146
-
147
-
148
-
149
-
150
-
151
-
152
-
153
-
154
-
155
-
156
-
157
-
158
-
159
-
160
-
161
-
162
-
163
-
164
-
165
-
166
-
167
-
168
-
169
-
170
-
171
-
172
-
173
-
174
-
175
-
176
-
177
-
178
-
179
-
180
-
181
-
182
-
183
-
184
-
185
-
186
-
187
-
188
-
189
-
190
-
191
-
192
-
193
-
194
-
195
-
196
-
197
-
198
-
199
-
200
-
201
-
202
-
203
-
204
-
205
-
206
-
207
-
208
-
209
-
210
-
211
-
212
-
213
-
214
-
215
-
216
-
217
-
218
-
219
-
220
-
221
-
222
-
223
-
224
-
225
-
226
-
227
-
228
-
229
-
230
-
231
-
232
-
233
-
234
-
235
-
236
-
237
-
238
-
239
-
240
-
241
-
242
-
243
-
244
-
245
-
246
-
247
-
248
-
249
-
250
-
251
-
252
-
253
-
254
-
255
-
256
-
257
-
258
-
259
-
260
-
261
-
262
-
263
-
264
-
265
-
266
-
267
-
268
-
269
-
270
-
271
-
272
-
273
-
274
-
275
-
276
-
277
-
278
-
279
-
280
-
281
-
282
-
 283
283 -
 284
284 -
 285
285 -
 286
286 -
 287
287 -
 288
288 -
 289
289 -
 290
290 -
 291
291 -
 292
292 -
 293
293 -
 294
294 -
 295
295 -
 296
296 -
 297
297 -
 298
298 -
 299
299 -
 300
300 -
 301
301 -
 302
302 -
 303
303 -
304
-
305
-
306
-
307
-
308
-
309
-
310
-
311
-
312
-
313
-
314
-
315
-
316
-
317
-
318
-
319
-
320
-
321
-
322
-
323
-
324
-
325
-
326
-
327
-
328
-
329
-
330
-
331
-
332
-
333
-
334
-
335
-
336
-
337
-
338
-
339
-
340
-
341
-
342
-
343
-
344
-
345
-
346
-
347
-
348
-
349
-
350
-
351
-
352
-
353
-
354
-
355
-
356
-
357
-
358
-
359
-
360
-
361
-
362
-
363
-
364
-
365
-
366
-
367
-
368
-
369
-
370
-
371
-
372
-
373
-
374
-
375
-
376
-
377
-
378
-
379
-
380
-
381
-
382
-
383
-
384
-
385
-
386
-
387
-
388
-
389
-
390
-
391
-
392
-
393
-
394
-
395
-
396
-
397
-
398
-
399
-
400
-
401
-
402
-
403
-
404
-
405
-
406
-
407
-
408
-
409
-
410
-
411
-
412
-
413
-
414
-
415
-
416
-
417
-
418
-
419
-
420
-
421
-
422
-
423
-
424
-
425
-
426
-
427
-
428
-
429
-
430
-
431
-
432
-
433
-
434
-
435
-
436
-
437
-
438
-
439
-
440
-
441
-
442
-
443
-
444
-
445
 |
 |

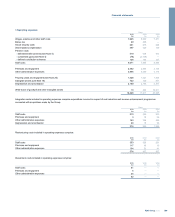
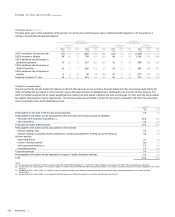
Sharesave
2010 2009
Average
exercise price
£
Shares under
option
(million)
Average
exercise price
£
Shares under
option
(million)
At 1 January 0.50 1,038
2.88 84
Granted 0.43 147
0.38 1,176
Exercised 0.38 (5) — —
Lapsed 0.45 (168) 0.77 (222)
At 31 December 0.48 1,012
0.50 1,038
Options are exercisable within six months of vesting; 23 million were exercisable at 31 December 2010 (2009 - 26 million). The weighted average share
price at the date of exercise of options was 45p (2009 - not applicable). At 31 December 2010, exercise prices ranged from 38p to 393p and the
average contractual life was 3.3 years (2009 - 38p to 393p and 3.2 years). The fair value of options granted in 2010 was £48 million (2009 - £220
million).
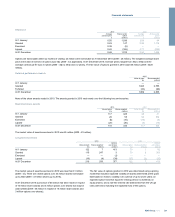
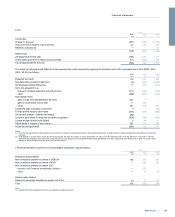
Deferred performance awards
2010
Value at grant
£m
Shares awarded
(million)
At 1 January — —
Granted 1,043 2,755
Forfeited (34) (90)
At 31 December 1,009 2,665
None of the share awards vested in 2010. The awards granted in 2010 vest evenly over the following two anniversaries.
Restricted share awards
2010 2009
Value at grant
£m
Shares awarded
(million) Value at grant
£m
Shares awarded
(million)
At 1 January 117 325
48 31
Granted 26 55 94 309
Exercised (6) (15) (16) (5)
Lapsed (27) (30) (9) (10)
At 31 December 110 335
117 325
The market value of awards exercised in 2010 was £6 million (2009 - £2 million).
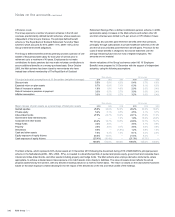
Long-term incentives
2010 2009
Value at grant
£m
Shares awarded
(million)
Options
over shares
(million) Value at grant
£m
Shares awarded
(million)
Options
over shares
(million)
At 1 January 122 7 413
79 1 92
Granted 115 247 3
70 8 353
Exercised — — (1) ———
Lapsed (18) (4) (38) (27) (2) (32)
At 31 December 219 250 377
122 7 413
The market value of awards exercised in 2010 was less than £1 million
(2009 - nil). There are vested options over 33 million shares exercisable
up to 2020 (2009 - 33 million shares up to 2014).
At 31 December 2010 a provision of £6 million had been made in respect
of 16 million share awards and 3 million options over shares that may be
cash-settled (2009 - £6 million in respect of 16 million share awards and
3million options over shares).
The fair value of options granted in 2010 was determined using a pricing
model that included: expected volatility of shares determined at the grant
date based on historic volatility over a period of up to seven years; an
expected option lives that equal the vesting period; no dividends on
equity shares; and a risk-free interest rate determined from the UK gilt
rates with terms matching the expected lives of the options.
291RBS Group 2010
Financial statements