RBS 2010 Annual Report Download - page 189
Download and view the complete annual report
Please find page 189 of the 2010 RBS annual report below. You can navigate through the pages in the report by either clicking on the pages listed below, or by using the keyword search tool below to find specific information within the annual report.-
 1
1 -
2
-
3
-
4
-
5
-
6
-
7
-
8
-
9
-
10
-
11
-
12
-
13
-
14
-
15
-
16
-
17
-
18
-
19
-
20
-
21
-
22
-
23
-
24
-
25
-
26
-
27
-
28
-
29
-
30
-
31
-
32
-
33
-
34
-
35
-
36
-
37
-
38
-
39
-
40
-
41
-
42
-
43
-
44
-
45
-
46
-
47
-
48
-
49
-
50
-
51
-
52
-
53
-
54
-
55
-
56
-
57
-
58
-
59
-
60
-
61
-
62
-
63
-
64
-
65
-
66
-
67
-
68
-
69
-
70
-
71
-
72
-
73
-
74
-
75
-
76
-
77
-
78
-
79
-
80
-
81
-
82
-
83
-
84
-
85
-
86
-
87
-
88
-
89
-
90
-
91
-
92
-
93
-
94
-
95
-
96
-
97
-
98
-
99
-
100
-
101
-
102
-
103
-
104
-
105
-
106
-
107
-
108
-
109
-
110
-
111
-
112
-
113
-
114
-
115
-
116
-
117
-
118
-
119
-
120
-
121
-
122
-
123
-
124
-
125
-
126
-
127
-
128
-
129
-
130
-
131
-
132
-
133
-
134
-
135
-
136
-
137
-
138
-
139
-
140
-
141
-
142
-
143
-
144
-
145
-
146
-
147
-
148
-
149
-
150
-
151
-
152
-
153
-
154
-
155
-
156
-
157
-
158
-
159
-
160
-
161
-
162
-
163
-
164
-
165
-
166
-
167
-
168
-
169
-
170
-
171
-
172
-
173
-
174
-
175
-
176
-
177
-
178
-
 179
179 -
 180
180 -
 181
181 -
 182
182 -
 183
183 -
 184
184 -
 185
185 -
 186
186 -
 187
187 -
 188
188 -
 189
189 -
 190
190 -
 191
191 -
 192
192 -
 193
193 -
 194
194 -
 195
195 -
 196
196 -
 197
197 -
 198
198 -
 199
199 -
200
-
201
-
202
-
203
-
204
-
205
-
206
-
207
-
208
-
209
-
210
-
211
-
212
-
213
-
214
-
215
-
216
-
217
-
218
-
219
-
220
-
221
-
222
-
223
-
224
-
225
-
226
-
227
-
228
-
229
-
230
-
231
-
232
-
233
-
234
-
235
-
236
-
237
-
238
-
239
-
240
-
241
-
242
-
243
-
244
-
245
-
246
-
247
-
248
-
249
-
250
-
251
-
252
-
253
-
254
-
255
-
256
-
257
-
258
-
259
-
260
-
261
-
262
-
263
-
264
-
265
-
266
-
267
-
268
-
269
-
270
-
271
-
272
-
273
-
274
-
275
-
276
-
277
-
278
-
279
-
280
-
281
-
282
-
283
-
284
-
285
-
286
-
287
-
288
-
289
-
290
-
291
-
292
-
293
-
294
-
295
-
296
-
297
-
298
-
299
-
300
-
301
-
302
-
303
-
304
-
305
-
306
-
307
-
308
-
309
-
310
-
311
-
312
-
313
-
314
-
315
-
316
-
317
-
318
-
319
-
320
-
321
-
322
-
323
-
324
-
325
-
326
-
327
-
328
-
329
-
330
-
331
-
332
-
333
-
334
-
335
-
336
-
337
-
338
-
339
-
340
-
341
-
342
-
343
-
344
-
345
-
346
-
347
-
348
-
349
-
350
-
351
-
352
-
353
-
354
-
355
-
356
-
357
-
358
-
359
-
360
-
361
-
362
-
363
-
364
-
365
-
366
-
367
-
368
-
369
-
370
-
371
-
372
-
373
-
374
-
375
-
376
-
377
-
378
-
379
-
380
-
381
-
382
-
383
-
384
-
385
-
386
-
387
-
388
-
389
-
390
-
391
-
392
-
393
-
394
-
395
-
396
-
397
-
398
-
399
-
400
-
401
-
402
-
403
-
404
-
405
-
406
-
407
-
408
-
409
-
410
-
411
-
412
-
413
-
414
-
415
-
416
-
417
-
418
-
419
-
420
-
421
-
422
-
423
-
424
-
425
-
426
-
427
-
428
-
429
-
430
-
431
-
432
-
433
-
434
-
435
-
436
-
437
-
438
-
439
-
440
-
441
-
442
-
443
-
444
-
445
 |
 |

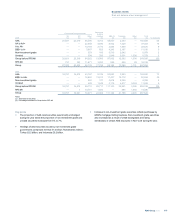
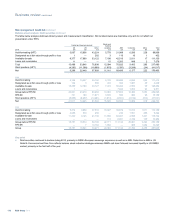
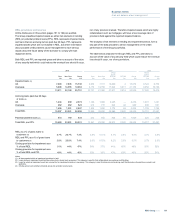
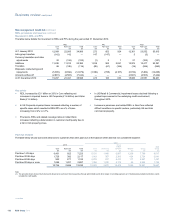
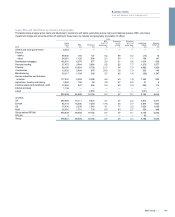
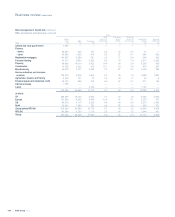
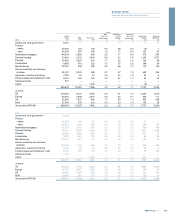
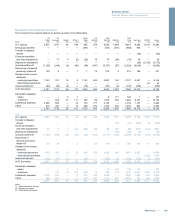
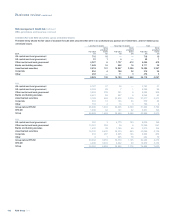
Risk elements in lending and potential problem loans by division
The tables below analyse the Group’s loans and advances to banks and customers (excluding reverse repos and disposal groups) and related REIL,
PPL, provisions, impairments, amounts written-off and related ratios by division.
Gross
loans REIL PPL REIL & PPL Provisions
Provisions
as %
of REIL
Provisions
as % o
f
REIL & PPL
REIL & PPL
as a % o
f
gross loans
Impairment
charge
Amounts
written-off
2010 £m £m £m £m £m % % % £m £m
UK Retail 108,813 4,620 175 4,795 2,741 59 57 4.4 1,160 1,135
UK Corporate 111,744 3,967 221 4,188 1,732 44 41 3.7 761 349
Wealth 18,350 223 38 261 66 30 25 1.4 18 9
Global Transaction Services 17,484 146 6 152 147 101 97 0.9 8 49
Ulster Bank 39,786 3,619 2 3,621 1,633 45 45 9.1 1,161 48
US Retail & Commercial 48,661 913 — 913 505 55 55 1.9 483 547
Retail & Commercial 344,838 13,488 442 13,930 6,824 51 49 4.0 3,591 2,137
Global Banking & Markets 122,054 1,719 31 1,750 1,042 61 60 1.4 146 87
RBS Insurance and other 2,741 — — — — — —
—
——
Core 469,633 15,207 473 15,680 7,866 52 50 3.3 3,737 2,224
Non-Core 109,206 23,391 160 23,551 10,316 44 44 21.6 5,407 3,818
Group before RFS MI 578,839 38,598 633 39,231 18,182 47 46 6.8 9,144 6,042
RFS MI 2——— — — —
—
42 —
Group 578,841 38,598 633 39,231 18,182 47 46 6.8 9,186 6,042
2009
UK Retail 103,812 4,641 — 4,641 2,677 58 58 4.5 1,679 1,150
UK Corporate 111,671 2,330 97 2,427 1,271 55 52 2.2 923 352
Wealth 15,525 218 38 256 55 25 21 1.6 33 12
Global Transaction Services 14,146 197 4 201 189 96 94 1.4 39 23
Ulster Bank 42,344 2,260 2 2,262 962 43 43 5.3 649 34
US Retail & Commercial 48,937 643 — 643 478 74 74 1.3 702 546
Retail & Commercial 336,435 10,289 141 10,430 5,632 55 54 3.1 4,025 2,117
Global Banking & Markets 130,898 1,800 131 1,931 1,289 72 67 1.5 542 169
RBS Insurance and other 2,648 — — — — — —
—
——
Core 469,981 12,089 272 12,361 6,921 57 56 2.6 4,567 2,286
Non-Core 148,623 22,900 652 23,552 8,252 36 35 15.8 8,523 4,192
Group before RFS MI 618,604 34,989 924 35,913 15,173 43 42 5.8 13,090 6,478
RFS MI 142,688 3,260 85 3,345 2,110 65 63 2.3 1,044 461
Group 761,292 38,249 1,009 39,258 17,283 45 44 5.2 14,134 6,939
2008
UK Retail 94,565 3,832 — 3,832 2,086 54 54 4.1 1,019 823
UK Corporate 117,036 1,254 74 1,328 696 56 52 1.1 319 377
Wealth 14,033 107 24 131 34 32 26 0.9 15 8
Global Transaction Services 16,950 53 — 53 43 81 81 0.3 48 15
Ulster Bank 46,628 1,196 1 1,197 491 41 41 2.6 106 20
US Retail & Commercial 62,168 424 — 424 298 70 70 0.7 437 312
Retail & Commercial 351,380 6,866 99 6,965 3,648 53 52 2.0 1,944 1,555
Global Banking & Markets 227,116 869 18 887 621 71 70 0.4 306 343
RBS Insurance and other 6,401 — — — — — —
—
— 80
Core 584,897 7,735 117 7,852 4,269 55 54 1.3 2,250 1,978
Non-Core 187,258 11,056 109 11,165 5,182 47 46 6.0 4,228 919
Group before RFS MI 772,155 18,791 226 19,017 9,451 50 50 2.5 6,478 2,897
RFS MI 153,696 2,470 — 2,470 1,565 63 63 1.6 613 251
Group 925,851 21,261 226 21,487 11,016 52 51 2.3 7,091 3,148
187RBS Group 2010
Business review
Risk and balance sheet management