RBS 2010 Annual Report Download - page 100
Download and view the complete annual report
Please find page 100 of the 2010 RBS annual report below. You can navigate through the pages in the report by either clicking on the pages listed below, or by using the keyword search tool below to find specific information within the annual report.-
 1
1 -
2
-
3
-
4
-
5
-
6
-
7
-
8
-
9
-
10
-
11
-
12
-
13
-
14
-
15
-
16
-
17
-
18
-
19
-
20
-
21
-
22
-
23
-
24
-
25
-
26
-
27
-
28
-
29
-
30
-
31
-
32
-
33
-
34
-
35
-
36
-
37
-
38
-
39
-
40
-
41
-
42
-
43
-
44
-
45
-
46
-
47
-
48
-
49
-
50
-
51
-
52
-
53
-
54
-
55
-
56
-
57
-
58
-
59
-
60
-
61
-
62
-
63
-
64
-
65
-
66
-
67
-
68
-
69
-
70
-
71
-
72
-
73
-
74
-
75
-
76
-
77
-
78
-
79
-
80
-
81
-
82
-
83
-
84
-
85
-
86
-
87
-
88
-
89
-
 90
90 -
 91
91 -
 92
92 -
 93
93 -
 94
94 -
 95
95 -
 96
96 -
 97
97 -
 98
98 -
 99
99 -
 100
100 -
 101
101 -
 102
102 -
 103
103 -
 104
104 -
 105
105 -
 106
106 -
 107
107 -
 108
108 -
 109
109 -
 110
110 -
111
-
112
-
113
-
114
-
115
-
116
-
117
-
118
-
119
-
120
-
121
-
122
-
123
-
124
-
125
-
126
-
127
-
128
-
129
-
130
-
131
-
132
-
133
-
134
-
135
-
136
-
137
-
138
-
139
-
140
-
141
-
142
-
143
-
144
-
145
-
146
-
147
-
148
-
149
-
150
-
151
-
152
-
153
-
154
-
155
-
156
-
157
-
158
-
159
-
160
-
161
-
162
-
163
-
164
-
165
-
166
-
167
-
168
-
169
-
170
-
171
-
172
-
173
-
174
-
175
-
176
-
177
-
178
-
179
-
180
-
181
-
182
-
183
-
184
-
185
-
186
-
187
-
188
-
189
-
190
-
191
-
192
-
193
-
194
-
195
-
196
-
197
-
198
-
199
-
200
-
201
-
202
-
203
-
204
-
205
-
206
-
207
-
208
-
209
-
210
-
211
-
212
-
213
-
214
-
215
-
216
-
217
-
218
-
219
-
220
-
221
-
222
-
223
-
224
-
225
-
226
-
227
-
228
-
229
-
230
-
231
-
232
-
233
-
234
-
235
-
236
-
237
-
238
-
239
-
240
-
241
-
242
-
243
-
244
-
245
-
246
-
247
-
248
-
249
-
250
-
251
-
252
-
253
-
254
-
255
-
256
-
257
-
258
-
259
-
260
-
261
-
262
-
263
-
264
-
265
-
266
-
267
-
268
-
269
-
270
-
271
-
272
-
273
-
274
-
275
-
276
-
277
-
278
-
279
-
280
-
281
-
282
-
283
-
284
-
285
-
286
-
287
-
288
-
289
-
290
-
291
-
292
-
293
-
294
-
295
-
296
-
297
-
298
-
299
-
300
-
301
-
302
-
303
-
304
-
305
-
306
-
307
-
308
-
309
-
310
-
311
-
312
-
313
-
314
-
315
-
316
-
317
-
318
-
319
-
320
-
321
-
322
-
323
-
324
-
325
-
326
-
327
-
328
-
329
-
330
-
331
-
332
-
333
-
334
-
335
-
336
-
337
-
338
-
339
-
340
-
341
-
342
-
343
-
344
-
345
-
346
-
347
-
348
-
349
-
350
-
351
-
352
-
353
-
354
-
355
-
356
-
357
-
358
-
359
-
360
-
361
-
362
-
363
-
364
-
365
-
366
-
367
-
368
-
369
-
370
-
371
-
372
-
373
-
374
-
375
-
376
-
377
-
378
-
379
-
380
-
381
-
382
-
383
-
384
-
385
-
386
-
387
-
388
-
389
-
390
-
391
-
392
-
393
-
394
-
395
-
396
-
397
-
398
-
399
-
400
-
401
-
402
-
403
-
404
-
405
-
406
-
407
-
408
-
409
-
410
-
411
-
412
-
413
-
414
-
415
-
416
-
417
-
418
-
419
-
420
-
421
-
422
-
423
-
424
-
425
-
426
-
427
-
428
-
429
-
430
-
431
-
432
-
433
-
434
-
435
-
436
-
437
-
438
-
439
-
440
-
441
-
442
-
443
-
444
-
445
 |
 |

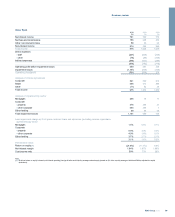
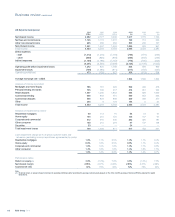
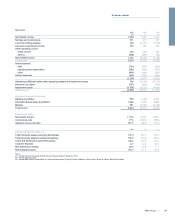
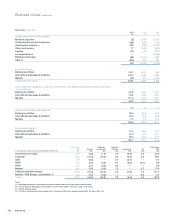
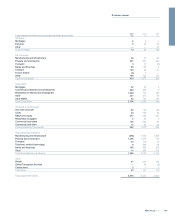
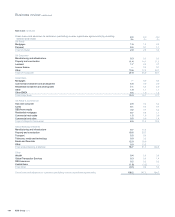
RBS Insurance continued
2010 2009 2008
Performance ratios
Return on equity (3) (7.9%) 1.7% 18.3%
Loss ratio (4) 92% 84% 70%
Commission ratio (5) 10% 9% 10%
Expense ratio (6) 13% 14% 14%
Combined operating ratio (7) 115% 106% 94%
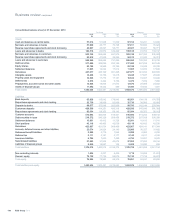
Balance sheet
General insurance reserves - total (£m) 7,559 7,030 6,673
Notes:
(1) Other is predominantly made up of the discontinued personal lines broker business.
(2) Total in-force policies include travel and creditor policies sold through RBS Group. These comprise travel policies included in bank accounts e.g. Royalties Gold Account, and creditor policies sold
with bank products including mortgage, loan and card repayment payment protection.
(3) Divisional return on equity is based on divisional operating (loss)/profit after tax, divided by divisional average notional equity (based on regulatory capital).
(4) Loss ratio is based on net claims divided by net premium income for the UK businesses.
(5) Commission ratio is based on fees and commissions divided by gross written premium income for the UK businesses.
(6) Expense ratio is based on expenses (excluding fees and commissions) divided by gross written premium income for the UK businesses.
(7) Combined operating ratio is expenses (including fees and commissions) divided by gross written premium income, added to the loss ratio, for the UK businesses.
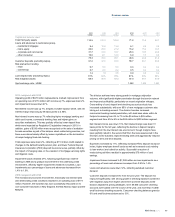
2010 compared with 2009
RBS Insurance has embarked on a significant programme of investment
designed to achieve a substantial lift in operational and financial
performance, ahead of the planned divestment of the business, with a
current target date of 2012. This programme encompasses the
enhancement of pricing capability, transformation of claims operations
and expense reduction, together with a range of other improvements
across the business, including a greater focus on capital management.
2010 as a whole was a disappointing profit year, impacted by significant
reserve strengthening for bodily injury claims and severe weather,
resulting in a loss of £295 million.
Income was down 2% (£63 million) against 2009, driven by a managed
reduction in the risk of the UK motor book, largely offset by significant
price increases:
xThis de-risking was achieved by a combination of rating action to
reduce the mix of higher-risk drivers, and the partial or total exit of
higher risk business lines (significantly scaling back the fleet and taxi
business and the exit of personal lines business sold through
insurance brokers). As a result in-force motor policies fell 14%
compared with 2009.
xEven with the significant reduction in the risk mix of the book,
average motor premiums were up 7% in the year, due to significant
price increases. The prices of like-for-like policies have increased by
35-40% over the last year. These increases were in addition to the
significant increases achieved in 2009.
Initiatives to grow ancillary income were also implemented during the
year resulting in revenues of £46 million in 2010 (£25 million in 2009).
Away from UK motor, overall home gross written premiums grew by 2%.
This included the exit from less profitable business in line with overall
strategy. Our underlying own brands business continues to grow
successfully, with gross written premiums increasing 4%.
The International business continued to invest in growth in 2010 with
gross written premiums of £425 million up 20% on 2009. The Italian
business successfully grew to a market share approaching 30% of the
direct insurer market. The German business grew 7% and is well
positioned to take advantage of the emerging shift to direct/internet
distribution in that market.
Several programmes to further improve the overall efficiency of the
business took effect during the year, including a reduction of six sites and
operational process improvements, which will continue to improve
efficiency.
Total in-force policies declined by 3%, driven by a fall of 14% in motor
policies. This was partly offset by higher travel policies, up 64% with new
business from a partnership with Nationwide Building Society
commencing in Q4 2010. The personal lines broker segment overall
declined by 43%, in line with business strategy.
Underwriting income declined by £63 million, with lower motor premium
income, driven by rating action. Increased fees and commissions
reflected profit sharing arrangements with UK Retail in relation to
insurance distribution to bank customers. Investment income was £28
million lower, reflecting the impact of low interest rates on returns on the
investment portfolio as well as lower gains realised on the sale of
investments.
Net claims were £326 million higher than in 2009, driven by increases to
bodily injury reserves relating to prior years, including allowance for
higher claims costs in respect of Periodic Payment Orders due to an
increased settlement rate of such claims. Although bodily injury
frequency has stabilised, severity has continued to deteriorate. Claims
were also impacted by the adverse weather experienced in the first and
fourth quarters.
Expenses were down 7%, driven by lower industry levies and marketing
costs.
RBS Group 201098
Business review continued