RBS 2010 Annual Report Download - page 326
Download and view the complete annual report
Please find page 326 of the 2010 RBS annual report below. You can navigate through the pages in the report by either clicking on the pages listed below, or by using the keyword search tool below to find specific information within the annual report.-
 1
1 -
2
-
3
-
4
-
5
-
6
-
7
-
8
-
9
-
10
-
11
-
12
-
13
-
14
-
15
-
16
-
17
-
18
-
19
-
20
-
21
-
22
-
23
-
24
-
25
-
26
-
27
-
28
-
29
-
30
-
31
-
32
-
33
-
34
-
35
-
36
-
37
-
38
-
39
-
40
-
41
-
42
-
43
-
44
-
45
-
46
-
47
-
48
-
49
-
50
-
51
-
52
-
53
-
54
-
55
-
56
-
57
-
58
-
59
-
60
-
61
-
62
-
63
-
64
-
65
-
66
-
67
-
68
-
69
-
70
-
71
-
72
-
73
-
74
-
75
-
76
-
77
-
78
-
79
-
80
-
81
-
82
-
83
-
84
-
85
-
86
-
87
-
88
-
89
-
90
-
91
-
92
-
93
-
94
-
95
-
96
-
97
-
98
-
99
-
100
-
101
-
102
-
103
-
104
-
105
-
106
-
107
-
108
-
109
-
110
-
111
-
112
-
113
-
114
-
115
-
116
-
117
-
118
-
119
-
120
-
121
-
122
-
123
-
124
-
125
-
126
-
127
-
128
-
129
-
130
-
131
-
132
-
133
-
134
-
135
-
136
-
137
-
138
-
139
-
140
-
141
-
142
-
143
-
144
-
145
-
146
-
147
-
148
-
149
-
150
-
151
-
152
-
153
-
154
-
155
-
156
-
157
-
158
-
159
-
160
-
161
-
162
-
163
-
164
-
165
-
166
-
167
-
168
-
169
-
170
-
171
-
172
-
173
-
174
-
175
-
176
-
177
-
178
-
179
-
180
-
181
-
182
-
183
-
184
-
185
-
186
-
187
-
188
-
189
-
190
-
191
-
192
-
193
-
194
-
195
-
196
-
197
-
198
-
199
-
200
-
201
-
202
-
203
-
204
-
205
-
206
-
207
-
208
-
209
-
210
-
211
-
212
-
213
-
214
-
215
-
216
-
217
-
218
-
219
-
220
-
221
-
222
-
223
-
224
-
225
-
226
-
227
-
228
-
229
-
230
-
231
-
232
-
233
-
234
-
235
-
236
-
237
-
238
-
239
-
240
-
241
-
242
-
243
-
244
-
245
-
246
-
247
-
248
-
249
-
250
-
251
-
252
-
253
-
254
-
255
-
256
-
257
-
258
-
259
-
260
-
261
-
262
-
263
-
264
-
265
-
266
-
267
-
268
-
269
-
270
-
271
-
272
-
273
-
274
-
275
-
276
-
277
-
278
-
279
-
280
-
281
-
282
-
283
-
284
-
285
-
286
-
287
-
288
-
289
-
290
-
291
-
292
-
293
-
294
-
295
-
296
-
297
-
298
-
299
-
300
-
301
-
302
-
303
-
304
-
305
-
306
-
307
-
308
-
309
-
310
-
311
-
312
-
313
-
314
-
315
-
 316
316 -
 317
317 -
 318
318 -
 319
319 -
 320
320 -
 321
321 -
 322
322 -
 323
323 -
 324
324 -
 325
325 -
 326
326 -
 327
327 -
 328
328 -
 329
329 -
 330
330 -
 331
331 -
 332
332 -
 333
333 -
 334
334 -
 335
335 -
 336
336 -
337
-
338
-
339
-
340
-
341
-
342
-
343
-
344
-
345
-
346
-
347
-
348
-
349
-
350
-
351
-
352
-
353
-
354
-
355
-
356
-
357
-
358
-
359
-
360
-
361
-
362
-
363
-
364
-
365
-
366
-
367
-
368
-
369
-
370
-
371
-
372
-
373
-
374
-
375
-
376
-
377
-
378
-
379
-
380
-
381
-
382
-
383
-
384
-
385
-
386
-
387
-
388
-
389
-
390
-
391
-
392
-
393
-
394
-
395
-
396
-
397
-
398
-
399
-
400
-
401
-
402
-
403
-
404
-
405
-
406
-
407
-
408
-
409
-
410
-
411
-
412
-
413
-
414
-
415
-
416
-
417
-
418
-
419
-
420
-
421
-
422
-
423
-
424
-
425
-
426
-
427
-
428
-
429
-
430
-
431
-
432
-
433
-
434
-
435
-
436
-
437
-
438
-
439
-
440
-
441
-
442
-
443
-
444
-
445
 |
 |

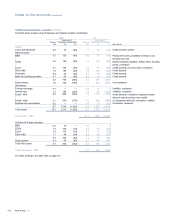
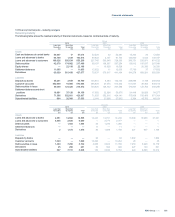
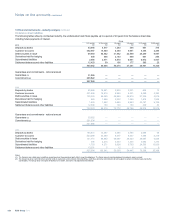
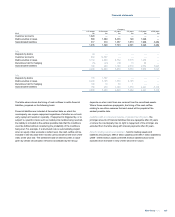
12 Financial instruments - valuation continued
Fair value of financial instruments not carried at fair value
The following table shows the carrying value and the fair value of financial instruments carried on the balance sheet at amortised cost.
Group
2010
Carrying value
2010
Fair value
2009
Carrying value
2009
Fair value
2008
Carrying value
2008
Fair value
£bn £bn £bn £bn £bn £bn
Financial assets
Cash and balances at central banks 57.0 57.0 52.3 52.3 12.4 12.4
Loans and advances to banks 36.2 36.1 46.3 46.0 82.0 81.9
Loans and advances to customers 493.1 468.8 684.1 650.9 821.1 776.1
Debt securities 7.1 6.4 9.9 9.0 13.0 11.5
Settlement balances 11.6 11.6 12.0 12.0 17.8 17.8
Financial liabilities
Deposits by banks 50.0 50.4 88.5 88.3 176.9 176.3
Customer accounts 438.5 438.6 552.8 552.1 575.5 576.4
Debt securities in issue 167.2 163.8 222.1 218.5 248.8 241.3
Settlement balances 11.0 11.0 10.4 10.4 11.7 11.7
Subordinated liabilities 25.9 21.9 36.4 31.6 47.6 36.4
The fair values of the company’s financial assets and liabilities are not materially different from their carrying values apart from subordinated liabilities,
2010 carrying value £8.0 billion, fair value £5.8 billion (2009 - carrying value £8.8 billion; fair value £4.9 billion; 2008 - carrying value £10.3 billion; fair
value £8.8 billion) and debt securities, 2010 carrying value £1.5 billion, fair value £1.8 billion (2009 - carrying value £1.3 billion, fair value £1.3 billion;
2008 - nil)
The fair value is the amount an asset could be exchanged, or a liability
settled, between knowledgeable, willing parties in an arm's length
transaction. Quoted market values are used where available; otherwise,
fair values have been estimated based on discounted expected future
cash flows and other valuation techniques. These techniques involve
uncertainties and require assumptions and judgments covering
prepayments, credit risk and discount rates. Changes in these
assumptions would significantly affect estimated fair values. The fair
values reported would not necessarily be realised in an immediate sale or
settlement. As a wide range of valuation techniques is available, it may
be inappropriate to compare the Group's fair value information to
independent markets or other financial institutions.
The fair values of intangible assets, such as core deposits, credit card
and other customer relationships are not included in the calculation of
these fair values as they are not financial instruments.
The assumptions and methodologies underlying the calculation of fair
values of financial instruments at the balance sheet date are as follows:
The fair value of financial instruments which are of short maturity (three
months or less) approximates their carrying value. This mainly applies to
cash and balances at central banks, items in the course of collection from
other banks, settlement balances, items in the course of transmission to
other banks and demand deposits.
Loans and advances to banks and customers
Fair value is estimated bygrouping loans into homogeneous portfolios
and applying a discount rate to the cash flows. The discount rate is based
on the market rate applicable at the balance sheet date for a similar
portfolio with similar maturity and credit risk characteristics.
Debt securities
Fair values are determined using quoted prices where available or by
reference to quoted prices of similar instruments.
Deposits by banks and customer accounts
The fair values of deposits are estimated using discounted cash flow
valuation techniques.
Debt securities in issue and subordinated liabilities
Fair values are determined using quoted prices where available or by
reference to valuation techniques, adjusting for own credit spreads where
appropriate.
RBS Group 2010324
Notes on the accounts continued