RBS 2010 Annual Report Download - page 380
Download and view the complete annual report
Please find page 380 of the 2010 RBS annual report below. You can navigate through the pages in the report by either clicking on the pages listed below, or by using the keyword search tool below to find specific information within the annual report.-
 1
1 -
2
-
3
-
4
-
5
-
6
-
7
-
8
-
9
-
10
-
11
-
12
-
13
-
14
-
15
-
16
-
17
-
18
-
19
-
20
-
21
-
22
-
23
-
24
-
25
-
26
-
27
-
28
-
29
-
30
-
31
-
32
-
33
-
34
-
35
-
36
-
37
-
38
-
39
-
40
-
41
-
42
-
43
-
44
-
45
-
46
-
47
-
48
-
49
-
50
-
51
-
52
-
53
-
54
-
55
-
56
-
57
-
58
-
59
-
60
-
61
-
62
-
63
-
64
-
65
-
66
-
67
-
68
-
69
-
70
-
71
-
72
-
73
-
74
-
75
-
76
-
77
-
78
-
79
-
80
-
81
-
82
-
83
-
84
-
85
-
86
-
87
-
88
-
89
-
90
-
91
-
92
-
93
-
94
-
95
-
96
-
97
-
98
-
99
-
100
-
101
-
102
-
103
-
104
-
105
-
106
-
107
-
108
-
109
-
110
-
111
-
112
-
113
-
114
-
115
-
116
-
117
-
118
-
119
-
120
-
121
-
122
-
123
-
124
-
125
-
126
-
127
-
128
-
129
-
130
-
131
-
132
-
133
-
134
-
135
-
136
-
137
-
138
-
139
-
140
-
141
-
142
-
143
-
144
-
145
-
146
-
147
-
148
-
149
-
150
-
151
-
152
-
153
-
154
-
155
-
156
-
157
-
158
-
159
-
160
-
161
-
162
-
163
-
164
-
165
-
166
-
167
-
168
-
169
-
170
-
171
-
172
-
173
-
174
-
175
-
176
-
177
-
178
-
179
-
180
-
181
-
182
-
183
-
184
-
185
-
186
-
187
-
188
-
189
-
190
-
191
-
192
-
193
-
194
-
195
-
196
-
197
-
198
-
199
-
200
-
201
-
202
-
203
-
204
-
205
-
206
-
207
-
208
-
209
-
210
-
211
-
212
-
213
-
214
-
215
-
216
-
217
-
218
-
219
-
220
-
221
-
222
-
223
-
224
-
225
-
226
-
227
-
228
-
229
-
230
-
231
-
232
-
233
-
234
-
235
-
236
-
237
-
238
-
239
-
240
-
241
-
242
-
243
-
244
-
245
-
246
-
247
-
248
-
249
-
250
-
251
-
252
-
253
-
254
-
255
-
256
-
257
-
258
-
259
-
260
-
261
-
262
-
263
-
264
-
265
-
266
-
267
-
268
-
269
-
270
-
271
-
272
-
273
-
274
-
275
-
276
-
277
-
278
-
279
-
280
-
281
-
282
-
283
-
284
-
285
-
286
-
287
-
288
-
289
-
290
-
291
-
292
-
293
-
294
-
295
-
296
-
297
-
298
-
299
-
300
-
301
-
302
-
303
-
304
-
305
-
306
-
307
-
308
-
309
-
310
-
311
-
312
-
313
-
314
-
315
-
316
-
317
-
318
-
319
-
320
-
321
-
322
-
323
-
324
-
325
-
326
-
327
-
328
-
329
-
330
-
331
-
332
-
333
-
334
-
335
-
336
-
337
-
338
-
339
-
340
-
341
-
342
-
343
-
344
-
345
-
346
-
347
-
348
-
349
-
350
-
351
-
352
-
353
-
354
-
355
-
356
-
357
-
358
-
359
-
360
-
361
-
362
-
363
-
364
-
365
-
366
-
367
-
368
-
369
-
 370
370 -
 371
371 -
 372
372 -
 373
373 -
 374
374 -
 375
375 -
 376
376 -
 377
377 -
 378
378 -
 379
379 -
 380
380 -
 381
381 -
 382
382 -
 383
383 -
 384
384 -
 385
385 -
 386
386 -
 387
387 -
 388
388 -
 389
389 -
 390
390 -
391
-
392
-
393
-
394
-
395
-
396
-
397
-
398
-
399
-
400
-
401
-
402
-
403
-
404
-
405
-
406
-
407
-
408
-
409
-
410
-
411
-
412
-
413
-
414
-
415
-
416
-
417
-
418
-
419
-
420
-
421
-
422
-
423
-
424
-
425
-
426
-
427
-
428
-
429
-
430
-
431
-
432
-
433
-
434
-
435
-
436
-
437
-
438
-
439
-
440
-
441
-
442
-
443
-
444
-
445
 |
 |

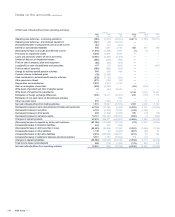
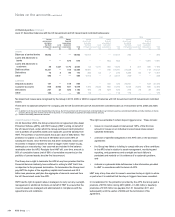
40 Segmental analysis continued
Group
Net
interest
income
Non-interest
income
Total
income
Operating
expenses
and
insurance
claims
Depreciation
and
amortisation
Impairment
losses
Operating
profit/(loss)
2010 £m £m £m £m £m £m £m
UK Retail 4,078 1,412 5,490 (2,957) (1) (1,160) 1,372
UK Corporate 2,572 1,323 3,895 (1,498) (173) (761) 1,463
Wealth 609 447 1,056 (723) (11) (18) 304
Global Transaction Services 974 1,587 2,561 (1,459) (5) (9) 1,088
Ulster Bank 761 214 975 (573) (2) (1,161) (761)
US Retail & Commercial 1,917 1,029 2,946 (2,024) (99) (517) 306
Global Banking & Markets 1,215 6,697 7,912 (4,281) (116) (151) 3,364
RBS Insurance 366 4,003 4,369 (4,641) (23) — (295)
Central items 25 400 425 1,007 (852) (3) 577
Core 12,517 17,112 29,629 (17,149) (1,282) (3,780) 7,418
Non-Core 1,683 1,350 3,033 (2,582) (480) (5,476) (5,505)
14,200 18,462 32,662 (19,731) (1,762) (9,256) 1,913
Reconciling items
RFS Holdings minority interest 9(151) (142) (9) 1 — (150)
Fair value of own debt —174 174 — — — 174
Amortisation of purchased intangible assets — — — — (369) — (369)
Integration and restructuring costs — — — (1,012) (20) — (1,032)
Gain on redemption of own debt —553 553 — — — 553
Strategic disposals —171 171 — — — 171
Bonus tax ———(99) — — (99)
Asset Protection Scheme credit default swap - fair value changes —(1,550) (1,550) — — — (1,550)
Write-down of goodwill and other intangible assets ———(10) — — (10)
14,209 17,659 31,868 (20,861) (2,150) (9,256) (399)
2009
UK Retail 3,452 1,629 5,081 (3,170) (3) (1,679) 229
UK Corporate 2,292 1,290 3,582 (1,376) (154) (927) 1,125
Wealth 663 446 1,109 (645) (11) (33) 420
Global Transaction Services 912 1,575 2,487 (1,462) (13) (39) 973
Ulster Bank 780 254 1,034 (748) (5) (649) (368)
US Retail & Commercial 1,775 949 2,724 (2,063) (72) (702) (113)
Global Banking & Markets 2,375 8,683 11,058 (4,518) (142) (640) 5,758
RBS Insurance 354 4,106 4,460 (4,363) (31) (8) 58
Central items (284) 617 333 1,053 (1,000) (1) 385
Core 12,319 19,549 31,868 (17,292) (1,431) (4,678) 8,467
Non-Core 1,248 (3,549) (2,301) (2,593) (442) (9,221) (14,557)
13,567 16,000 29,567 (19,885) (1,873) (13,899) (6,090)
Reconciling items
RFS Holdings minority interest (179) (142) (321) (32) (3) — (356)
Fair value of own debt —(142) (142) — — — (142)
Amortisation of purchased intangible assets — — — — (272) — (272)
Integration and restructuring costs — — — (1,268) (18) — (1,286)
Gain on redemption of own debt —3,790 3,790 — — — 3,790
Strategic disposals —132 132 — — — 132
Bonus tax ———(208) — — (208)
Gains on pensions curtailment ———2,148 — — 2,148
Write-down of goodwill and other intangible assets ———(363) — — (363)
13,388 19,638 33,026 (19,608) (2,166) (13,899) (2,647)
RBS Group 2010378
Notes on the accounts continuedNotes on the accounts