RBS 2010 Annual Report Download - page 42
Download and view the complete annual report
Please find page 42 of the 2010 RBS annual report below. You can navigate through the pages in the report by either clicking on the pages listed below, or by using the keyword search tool below to find specific information within the annual report.-
 1
1 -
2
-
3
-
4
-
5
-
6
-
7
-
8
-
9
-
10
-
11
-
12
-
13
-
14
-
15
-
16
-
17
-
18
-
19
-
20
-
21
-
22
-
23
-
24
-
25
-
26
-
27
-
28
-
29
-
30
-
31
-
 32
32 -
 33
33 -
 34
34 -
 35
35 -
 36
36 -
 37
37 -
 38
38 -
 39
39 -
 40
40 -
 41
41 -
 42
42 -
 43
43 -
 44
44 -
 45
45 -
 46
46 -
 47
47 -
 48
48 -
 49
49 -
 50
50 -
 51
51 -
 52
52 -
53
-
54
-
55
-
56
-
57
-
58
-
59
-
60
-
61
-
62
-
63
-
64
-
65
-
66
-
67
-
68
-
69
-
70
-
71
-
72
-
73
-
74
-
75
-
76
-
77
-
78
-
79
-
80
-
81
-
82
-
83
-
84
-
85
-
86
-
87
-
88
-
89
-
90
-
91
-
92
-
93
-
94
-
95
-
96
-
97
-
98
-
99
-
100
-
101
-
102
-
103
-
104
-
105
-
106
-
107
-
108
-
109
-
110
-
111
-
112
-
113
-
114
-
115
-
116
-
117
-
118
-
119
-
120
-
121
-
122
-
123
-
124
-
125
-
126
-
127
-
128
-
129
-
130
-
131
-
132
-
133
-
134
-
135
-
136
-
137
-
138
-
139
-
140
-
141
-
142
-
143
-
144
-
145
-
146
-
147
-
148
-
149
-
150
-
151
-
152
-
153
-
154
-
155
-
156
-
157
-
158
-
159
-
160
-
161
-
162
-
163
-
164
-
165
-
166
-
167
-
168
-
169
-
170
-
171
-
172
-
173
-
174
-
175
-
176
-
177
-
178
-
179
-
180
-
181
-
182
-
183
-
184
-
185
-
186
-
187
-
188
-
189
-
190
-
191
-
192
-
193
-
194
-
195
-
196
-
197
-
198
-
199
-
200
-
201
-
202
-
203
-
204
-
205
-
206
-
207
-
208
-
209
-
210
-
211
-
212
-
213
-
214
-
215
-
216
-
217
-
218
-
219
-
220
-
221
-
222
-
223
-
224
-
225
-
226
-
227
-
228
-
229
-
230
-
231
-
232
-
233
-
234
-
235
-
236
-
237
-
238
-
239
-
240
-
241
-
242
-
243
-
244
-
245
-
246
-
247
-
248
-
249
-
250
-
251
-
252
-
253
-
254
-
255
-
256
-
257
-
258
-
259
-
260
-
261
-
262
-
263
-
264
-
265
-
266
-
267
-
268
-
269
-
270
-
271
-
272
-
273
-
274
-
275
-
276
-
277
-
278
-
279
-
280
-
281
-
282
-
283
-
284
-
285
-
286
-
287
-
288
-
289
-
290
-
291
-
292
-
293
-
294
-
295
-
296
-
297
-
298
-
299
-
300
-
301
-
302
-
303
-
304
-
305
-
306
-
307
-
308
-
309
-
310
-
311
-
312
-
313
-
314
-
315
-
316
-
317
-
318
-
319
-
320
-
321
-
322
-
323
-
324
-
325
-
326
-
327
-
328
-
329
-
330
-
331
-
332
-
333
-
334
-
335
-
336
-
337
-
338
-
339
-
340
-
341
-
342
-
343
-
344
-
345
-
346
-
347
-
348
-
349
-
350
-
351
-
352
-
353
-
354
-
355
-
356
-
357
-
358
-
359
-
360
-
361
-
362
-
363
-
364
-
365
-
366
-
367
-
368
-
369
-
370
-
371
-
372
-
373
-
374
-
375
-
376
-
377
-
378
-
379
-
380
-
381
-
382
-
383
-
384
-
385
-
386
-
387
-
388
-
389
-
390
-
391
-
392
-
393
-
394
-
395
-
396
-
397
-
398
-
399
-
400
-
401
-
402
-
403
-
404
-
405
-
406
-
407
-
408
-
409
-
410
-
411
-
412
-
413
-
414
-
415
-
416
-
417
-
418
-
419
-
420
-
421
-
422
-
423
-
424
-
425
-
426
-
427
-
428
-
429
-
430
-
431
-
432
-
433
-
434
-
435
-
436
-
437
-
438
-
439
-
440
-
441
-
442
-
443
-
444
-
445
 |
 |

RBS Group 201040
Non-Core Division
Helping to deliver the Strategic Plan
The Non-Core Division is a central pillar of the Group’s Strategic Plan,
helping to make RBS stronger and safer. We help to lower the Group’s
risk exposure, strengthen its funding position and allow management to
focus on the Core Bank. As we approach the mid-point of our five-year
journey, we have achieved significant progress and are on-track to meet
our targets.
But we don’t take further progress for granted. Our Definition to
Delivery programme ensured we moved from defining and structuring
the division in 2009 to delivering huge strides in reducing assets and
managing risk in 2010. Moving into the next stage, we are exploring
options for exiting from our assets. The division’s leadership team
has been strengthened. We are in a good position to continue the
momentum of progress into 2011.
Exiting from Non-Core assets
In 2010, we passed the £100 billion milestone in our journey, reducing
third party assets (“TPAs”) to £138 billion at year-end, down from the initial
December 2008 portfolio of £258 billion. We also reduced our portfolio
of derivatives from an initial £85 billion to £16 billion. Despite sometimes
challenging market conditions, careful preparation and asset management
enabled us to take, and sometimes accelerate, exit opportunities.
While our disposal programme has attracted the most attention, the run-
off programme and asset restructuring deals have also been important.
•International Businesses & Portfolios made huge progress in the
disposal of non-core country or whole businesses. Sale agreements
were reached for our Non-Core businesses in Latin America, India,
Kazakhstan, Pakistan and the United Arab Emirates, as well as for part
of our Asset Management business and for our Invoice Finance
businesses in Germany and France. We completed the transfer of
assets in six Asian countries to ANZ Group.
•Portfolio & Banking agreed deals to dispose of non-core portfolio
assets. Examples included the sale of a portfolio of US and European
private equity fund interests, the sale of Leveraged Finance assets
through a Collateralised Loan Obligation and the sale of property
assets, such as the Cumberland and five other hotels.
•Non-Core Markets achieved significant progress in reducing assets
through sales and the unwinding of facilities and risk exposures.
Markets TPAs fell from £24.4 billion at the start of the year to £13.6
billion at the end of 2010.
•Across all areas, our run-off programme has helped to deliver
significant reductions through holding assets to maturity, exploring
ways to achieve earlier repayment and identifying options for assets
to be refinanced elsewhere.
•In line with the settlement agreed with the EC in 2009, we completed the
sale of substantially all of RBS’s interest in RBS Sempra Commodities.
Though the Non-Core Division was established to separately manage
and exit from the portfolio of non-core assets, we work closely with other
parts of RBS Group in achieving these aims. For example, colleagues in
GBM have provided invaluable assistance in structuring and delivering
several deals.
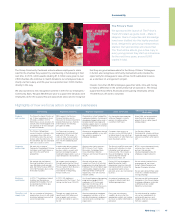
The Non-Core Division separately manages
assets that the Group intends to exit from
by 2013. The division contains a range of
businesses and asset portfolios, primarily
originating from GBM, linked to proprietary
trading, higher risk profile asset portfolios
(including excess risk concentrations) and
other illiquid portfolios. It also includes a
number of portfolios and businesses that the
Group has concluded are no longer part of
its core strategy.
2010 2009
Performance highlights £m £m
Net interest income 1,959 1,534
Non-interest income 1,074 (3,835)
Total income 3,033 (2,301)
Expenses (2,325) (2,447)
Operating profit/(loss) before other operating
charges and impairment losses 708 (4,748)
Insurance net claims (737) (588)
Impairment losses (5,476) (9,221)
Operating loss (5,505) (14,557)
Risk-weighted assets (£bn) 153.7 171.3
Net interest margin 1.16% 0.69%
Cost:income ratio 77% (106%)
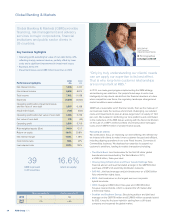
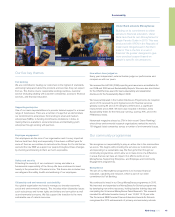
Nathan Bostock
Head of Restructuring & Risk
MFor biographies
see pages 226-229
62%
fall in operating losses
4
wholesale country
exits in the year