RBS 2010 Annual Report Download - page 32
Download and view the complete annual report
Please find page 32 of the 2010 RBS annual report below. You can navigate through the pages in the report by either clicking on the pages listed below, or by using the keyword search tool below to find specific information within the annual report.-
 1
1 -
2
-
3
-
4
-
5
-
6
-
7
-
8
-
9
-
10
-
11
-
12
-
13
-
14
-
15
-
16
-
17
-
18
-
19
-
20
-
21
-
 22
22 -
 23
23 -
 24
24 -
 25
25 -
 26
26 -
 27
27 -
 28
28 -
 29
29 -
 30
30 -
 31
31 -
 32
32 -
 33
33 -
 34
34 -
 35
35 -
 36
36 -
 37
37 -
 38
38 -
 39
39 -
 40
40 -
 41
41 -
 42
42 -
43
-
44
-
45
-
46
-
47
-
48
-
49
-
50
-
51
-
52
-
53
-
54
-
55
-
56
-
57
-
58
-
59
-
60
-
61
-
62
-
63
-
64
-
65
-
66
-
67
-
68
-
69
-
70
-
71
-
72
-
73
-
74
-
75
-
76
-
77
-
78
-
79
-
80
-
81
-
82
-
83
-
84
-
85
-
86
-
87
-
88
-
89
-
90
-
91
-
92
-
93
-
94
-
95
-
96
-
97
-
98
-
99
-
100
-
101
-
102
-
103
-
104
-
105
-
106
-
107
-
108
-
109
-
110
-
111
-
112
-
113
-
114
-
115
-
116
-
117
-
118
-
119
-
120
-
121
-
122
-
123
-
124
-
125
-
126
-
127
-
128
-
129
-
130
-
131
-
132
-
133
-
134
-
135
-
136
-
137
-
138
-
139
-
140
-
141
-
142
-
143
-
144
-
145
-
146
-
147
-
148
-
149
-
150
-
151
-
152
-
153
-
154
-
155
-
156
-
157
-
158
-
159
-
160
-
161
-
162
-
163
-
164
-
165
-
166
-
167
-
168
-
169
-
170
-
171
-
172
-
173
-
174
-
175
-
176
-
177
-
178
-
179
-
180
-
181
-
182
-
183
-
184
-
185
-
186
-
187
-
188
-
189
-
190
-
191
-
192
-
193
-
194
-
195
-
196
-
197
-
198
-
199
-
200
-
201
-
202
-
203
-
204
-
205
-
206
-
207
-
208
-
209
-
210
-
211
-
212
-
213
-
214
-
215
-
216
-
217
-
218
-
219
-
220
-
221
-
222
-
223
-
224
-
225
-
226
-
227
-
228
-
229
-
230
-
231
-
232
-
233
-
234
-
235
-
236
-
237
-
238
-
239
-
240
-
241
-
242
-
243
-
244
-
245
-
246
-
247
-
248
-
249
-
250
-
251
-
252
-
253
-
254
-
255
-
256
-
257
-
258
-
259
-
260
-
261
-
262
-
263
-
264
-
265
-
266
-
267
-
268
-
269
-
270
-
271
-
272
-
273
-
274
-
275
-
276
-
277
-
278
-
279
-
280
-
281
-
282
-
283
-
284
-
285
-
286
-
287
-
288
-
289
-
290
-
291
-
292
-
293
-
294
-
295
-
296
-
297
-
298
-
299
-
300
-
301
-
302
-
303
-
304
-
305
-
306
-
307
-
308
-
309
-
310
-
311
-
312
-
313
-
314
-
315
-
316
-
317
-
318
-
319
-
320
-
321
-
322
-
323
-
324
-
325
-
326
-
327
-
328
-
329
-
330
-
331
-
332
-
333
-
334
-
335
-
336
-
337
-
338
-
339
-
340
-
341
-
342
-
343
-
344
-
345
-
346
-
347
-
348
-
349
-
350
-
351
-
352
-
353
-
354
-
355
-
356
-
357
-
358
-
359
-
360
-
361
-
362
-
363
-
364
-
365
-
366
-
367
-
368
-
369
-
370
-
371
-
372
-
373
-
374
-
375
-
376
-
377
-
378
-
379
-
380
-
381
-
382
-
383
-
384
-
385
-
386
-
387
-
388
-
389
-
390
-
391
-
392
-
393
-
394
-
395
-
396
-
397
-
398
-
399
-
400
-
401
-
402
-
403
-
404
-
405
-
406
-
407
-
408
-
409
-
410
-
411
-
412
-
413
-
414
-
415
-
416
-
417
-
418
-
419
-
420
-
421
-
422
-
423
-
424
-
425
-
426
-
427
-
428
-
429
-
430
-
431
-
432
-
433
-
434
-
435
-
436
-
437
-
438
-
439
-
440
-
441
-
442
-
443
-
444
-
445
 |
 |

RBS Group 201030
Ulster Bank
Conditions in Ireland’s economy remained very
challenging indeed throughout 2010 and our
results reflect that. Continuing stresses in
property markets, together with pressure on
borrowers who depend on consumer spending
resulted in increased losses on corporate
lending. Higher unemployment and lower
disposable incomes contributed to higher
mortgage impairments. In Northern Ireland too,
the economy was weak and unemployment
increased over the year.
These factors lie behind the increase in our impairment losses to
£1.2 billion and our operating loss of £761 million. Despite lower income,
an impressive 24% reduction in costs contributed to a pre-impairment
operating profit of £400 million.
Lower costs was one objective of the five-year strategy we published
in 2009. We will continue to make changes inside our business to help
us achieve those aims. But we recognise that if 2010 was tough for
us, it was just as difficult for our customers and we have tried hard to
support them. In 2010, we said that we wanted to become Ireland’s most
helpful bank, across the whole island. Helping our customers helps our
business too, making it stronger and more resilient for the future.
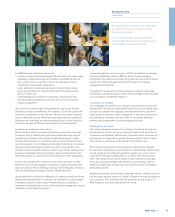
Listening to customers and providing ‘Help For What Matters’
In September, we launched the ‘Help For What Matters’ programme.
We listened to what our customers need and developed commitments
that focus on the issues that matter to them.
For personal customers this means:
•making banking easy, including extended branch opening hours,
Saturday openings, less queuing and helpful service;
•treating our customers fairly, including text alerts to avoid unnecessary
charges and assistance with debt problems; and
•local support, including no branch closures, a community fund
and a ‘Give a Day’ volunteering programme.
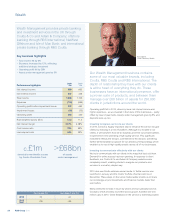
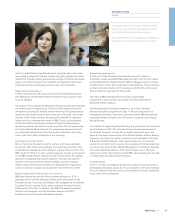
Cormac McCarthy,
Chief Executive,
Ulster Bank
Ulster Bank is a leading bank in Northern
Ireland and the Republic of Ireland. It
provides a comprehensive range of financial
services through both its Retail Markets
division, which has a network of branches and
operates in the personal and bancassurance
sectors, and its Corporate Markets division
which provides services to business
customers, corporates and institutional
markets.
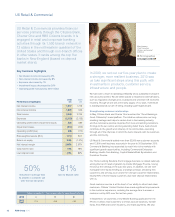
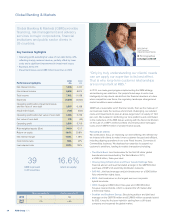
Key business highlights
• Net interest income decreased by 1%
• Non-interest income decreased by 14%
• Expenses decreased by 24%
• Impairment losses increased by £512 million
2010 2009
Performance highlights £m £m
Net interest income 761 780
Non-interest income 214 254
Total income 975 1,034
Expenses (575) (753)
Operating profit before impairment losses 400 281
Impairment losses (1,161) (649)
Operating loss (761) (368)
Risk-weighted assets (£bn) 31.6 29.9
Return on equity (21.0%) (11.7%)
Net interest margin 1.84% 1.87%
Cost:income ratio 59% 73%
Loan:deposit ratio 152% 177%
Return on equity (%) Cost:income ratio (%) Loan:deposit ratio (%)
2010 (21) 59 152
2013 >15 c.50 <150
target
8%
increase in customer
deposit balances in
constant currencies
45
branches opened on
Saturday for the first time