RBS 2010 Annual Report Download - page 168
Download and view the complete annual report
Please find page 168 of the 2010 RBS annual report below. You can navigate through the pages in the report by either clicking on the pages listed below, or by using the keyword search tool below to find specific information within the annual report.-
 1
1 -
2
-
3
-
4
-
5
-
6
-
7
-
8
-
9
-
10
-
11
-
12
-
13
-
14
-
15
-
16
-
17
-
18
-
19
-
20
-
21
-
22
-
23
-
24
-
25
-
26
-
27
-
28
-
29
-
30
-
31
-
32
-
33
-
34
-
35
-
36
-
37
-
38
-
39
-
40
-
41
-
42
-
43
-
44
-
45
-
46
-
47
-
48
-
49
-
50
-
51
-
52
-
53
-
54
-
55
-
56
-
57
-
58
-
59
-
60
-
61
-
62
-
63
-
64
-
65
-
66
-
67
-
68
-
69
-
70
-
71
-
72
-
73
-
74
-
75
-
76
-
77
-
78
-
79
-
80
-
81
-
82
-
83
-
84
-
85
-
86
-
87
-
88
-
89
-
90
-
91
-
92
-
93
-
94
-
95
-
96
-
97
-
98
-
99
-
100
-
101
-
102
-
103
-
104
-
105
-
106
-
107
-
108
-
109
-
110
-
111
-
112
-
113
-
114
-
115
-
116
-
117
-
118
-
119
-
120
-
121
-
122
-
123
-
124
-
125
-
126
-
127
-
128
-
129
-
130
-
131
-
132
-
133
-
134
-
135
-
136
-
137
-
138
-
139
-
140
-
141
-
142
-
143
-
144
-
145
-
146
-
147
-
148
-
149
-
150
-
151
-
152
-
153
-
154
-
155
-
156
-
157
-
 158
158 -
 159
159 -
 160
160 -
 161
161 -
 162
162 -
 163
163 -
 164
164 -
 165
165 -
 166
166 -
 167
167 -
 168
168 -
 169
169 -
 170
170 -
 171
171 -
 172
172 -
 173
173 -
 174
174 -
 175
175 -
 176
176 -
 177
177 -
 178
178 -
179
-
180
-
181
-
182
-
183
-
184
-
185
-
186
-
187
-
188
-
189
-
190
-
191
-
192
-
193
-
194
-
195
-
196
-
197
-
198
-
199
-
200
-
201
-
202
-
203
-
204
-
205
-
206
-
207
-
208
-
209
-
210
-
211
-
212
-
213
-
214
-
215
-
216
-
217
-
218
-
219
-
220
-
221
-
222
-
223
-
224
-
225
-
226
-
227
-
228
-
229
-
230
-
231
-
232
-
233
-
234
-
235
-
236
-
237
-
238
-
239
-
240
-
241
-
242
-
243
-
244
-
245
-
246
-
247
-
248
-
249
-
250
-
251
-
252
-
253
-
254
-
255
-
256
-
257
-
258
-
259
-
260
-
261
-
262
-
263
-
264
-
265
-
266
-
267
-
268
-
269
-
270
-
271
-
272
-
273
-
274
-
275
-
276
-
277
-
278
-
279
-
280
-
281
-
282
-
283
-
284
-
285
-
286
-
287
-
288
-
289
-
290
-
291
-
292
-
293
-
294
-
295
-
296
-
297
-
298
-
299
-
300
-
301
-
302
-
303
-
304
-
305
-
306
-
307
-
308
-
309
-
310
-
311
-
312
-
313
-
314
-
315
-
316
-
317
-
318
-
319
-
320
-
321
-
322
-
323
-
324
-
325
-
326
-
327
-
328
-
329
-
330
-
331
-
332
-
333
-
334
-
335
-
336
-
337
-
338
-
339
-
340
-
341
-
342
-
343
-
344
-
345
-
346
-
347
-
348
-
349
-
350
-
351
-
352
-
353
-
354
-
355
-
356
-
357
-
358
-
359
-
360
-
361
-
362
-
363
-
364
-
365
-
366
-
367
-
368
-
369
-
370
-
371
-
372
-
373
-
374
-
375
-
376
-
377
-
378
-
379
-
380
-
381
-
382
-
383
-
384
-
385
-
386
-
387
-
388
-
389
-
390
-
391
-
392
-
393
-
394
-
395
-
396
-
397
-
398
-
399
-
400
-
401
-
402
-
403
-
404
-
405
-
406
-
407
-
408
-
409
-
410
-
411
-
412
-
413
-
414
-
415
-
416
-
417
-
418
-
419
-
420
-
421
-
422
-
423
-
424
-
425
-
426
-
427
-
428
-
429
-
430
-
431
-
432
-
433
-
434
-
435
-
436
-
437
-
438
-
439
-
440
-
441
-
442
-
443
-
444
-
445
 |
 |

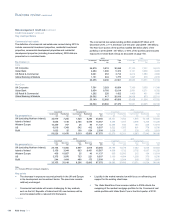
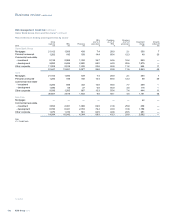
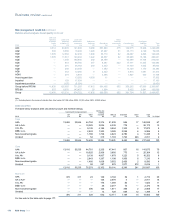
Risk management: Credit risk continued
Balance sheet analysis
All the disclosures in this section (pages 166 to 180) are audited unless otherwise indicated by an asterisk (*).
The following tables provide an analysis of financial assets by industry sector, geography and internal credit quality gradings. Credit risk assets analysed
on the preceding pages are reported internally to senior management, however they exclude certain exposures, primarily debt securities, and take
account of legal agreements, including master netting arrangements that provide a right of legal set-off but do not meet the criteria for offset in IFRS.
The analysis below is therefore provided to supplement the credit risk assets analysis and to reconcile to the consolidated balance sheet.
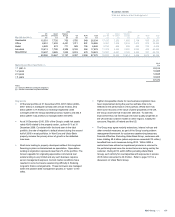
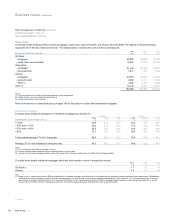
Industry and geographical analysis
The tables belowand on pages 167 to 173 analyse total financial assets gross of provisions by industry sector (for Group before RFS MI) and
geography (for Group before RFS MI and RFS MI).
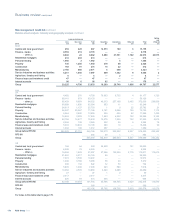
Industry analysis
The table belowanalyses total financial assets by industry.
Loans and advances
Core Non-Core Total Securities Derivatives Other (1) Total
Netting
and
offset (2)
2010 £m £m £m £m £m £m £m £m
Total
Central and local government 7,426 1,671 9,097 130,890 7,560 291 147,838 3,916
Finance - banks 99,583 1,024 100,607 — — — 100,607 —
- other (3) 97,967 7,891 105,858 95,954 399,318 12,185 613,315 403,387
Residential mortgages 140,359 6,142 146,501 808 6 — 147,315 14
Personal lending 33,581 3,891 37,472 63 15 48 37,598 11
Property 42,455 47,651 90,106 2,937 3,830 28 96,901 1,041
Construction 8,680 3,352 12,032 87 780 — 12,899 1,392
Manufacturing 26,186 6,520 32,706 897 3,229 — 36,832 2,156
Service industries and business activities 95,252 22,384 117,636 8,077 12,285 388 138,386 6,400
Agriculture, forestry and fishing 3,758 135 3,893 29 40 — 3,962 94
Finance lease and instalment credit 8,320 8,530 16,850 15 14 — 16,879 134
Interest accruals 921 279 1, 200 1,398 — — 2,598 —
Total gross of provisions 564,488 109,470 673,958 241,155 427,077 12,940 1,355,130 418,545
Provisions (18,182) (1,477) — (29) (19,688) n/a
Group before RFS MI 655,776 239,678 427,077 12,911 1,335,442 418,545
RFS MI gross of provisions 2 — — — 2 —
Group 655,778 239,678 427,077 12,911 1,335,444 418,545
Comprising:
Repurchase agreements 10,712
Derivative balances 361,493
Derivative collateral 31,015
Other 15,325
418,545
For notes to this table refer to page 173.
RBS Group 2010166
Business review continued