RBS 2010 Annual Report Download - page 71
Download and view the complete annual report
Please find page 71 of the 2010 RBS annual report below. You can navigate through the pages in the report by either clicking on the pages listed below, or by using the keyword search tool below to find specific information within the annual report.-
 1
1 -
2
-
3
-
4
-
5
-
6
-
7
-
8
-
9
-
10
-
11
-
12
-
13
-
14
-
15
-
16
-
17
-
18
-
19
-
20
-
21
-
22
-
23
-
24
-
25
-
26
-
27
-
28
-
29
-
30
-
31
-
32
-
33
-
34
-
35
-
36
-
37
-
38
-
39
-
40
-
41
-
42
-
43
-
44
-
45
-
46
-
47
-
48
-
49
-
50
-
51
-
52
-
53
-
54
-
55
-
56
-
57
-
58
-
59
-
60
-
 61
61 -
 62
62 -
 63
63 -
 64
64 -
 65
65 -
 66
66 -
 67
67 -
 68
68 -
 69
69 -
 70
70 -
 71
71 -
 72
72 -
 73
73 -
 74
74 -
 75
75 -
 76
76 -
 77
77 -
 78
78 -
 79
79 -
 80
80 -
 81
81 -
82
-
83
-
84
-
85
-
86
-
87
-
88
-
89
-
90
-
91
-
92
-
93
-
94
-
95
-
96
-
97
-
98
-
99
-
100
-
101
-
102
-
103
-
104
-
105
-
106
-
107
-
108
-
109
-
110
-
111
-
112
-
113
-
114
-
115
-
116
-
117
-
118
-
119
-
120
-
121
-
122
-
123
-
124
-
125
-
126
-
127
-
128
-
129
-
130
-
131
-
132
-
133
-
134
-
135
-
136
-
137
-
138
-
139
-
140
-
141
-
142
-
143
-
144
-
145
-
146
-
147
-
148
-
149
-
150
-
151
-
152
-
153
-
154
-
155
-
156
-
157
-
158
-
159
-
160
-
161
-
162
-
163
-
164
-
165
-
166
-
167
-
168
-
169
-
170
-
171
-
172
-
173
-
174
-
175
-
176
-
177
-
178
-
179
-
180
-
181
-
182
-
183
-
184
-
185
-
186
-
187
-
188
-
189
-
190
-
191
-
192
-
193
-
194
-
195
-
196
-
197
-
198
-
199
-
200
-
201
-
202
-
203
-
204
-
205
-
206
-
207
-
208
-
209
-
210
-
211
-
212
-
213
-
214
-
215
-
216
-
217
-
218
-
219
-
220
-
221
-
222
-
223
-
224
-
225
-
226
-
227
-
228
-
229
-
230
-
231
-
232
-
233
-
234
-
235
-
236
-
237
-
238
-
239
-
240
-
241
-
242
-
243
-
244
-
245
-
246
-
247
-
248
-
249
-
250
-
251
-
252
-
253
-
254
-
255
-
256
-
257
-
258
-
259
-
260
-
261
-
262
-
263
-
264
-
265
-
266
-
267
-
268
-
269
-
270
-
271
-
272
-
273
-
274
-
275
-
276
-
277
-
278
-
279
-
280
-
281
-
282
-
283
-
284
-
285
-
286
-
287
-
288
-
289
-
290
-
291
-
292
-
293
-
294
-
295
-
296
-
297
-
298
-
299
-
300
-
301
-
302
-
303
-
304
-
305
-
306
-
307
-
308
-
309
-
310
-
311
-
312
-
313
-
314
-
315
-
316
-
317
-
318
-
319
-
320
-
321
-
322
-
323
-
324
-
325
-
326
-
327
-
328
-
329
-
330
-
331
-
332
-
333
-
334
-
335
-
336
-
337
-
338
-
339
-
340
-
341
-
342
-
343
-
344
-
345
-
346
-
347
-
348
-
349
-
350
-
351
-
352
-
353
-
354
-
355
-
356
-
357
-
358
-
359
-
360
-
361
-
362
-
363
-
364
-
365
-
366
-
367
-
368
-
369
-
370
-
371
-
372
-
373
-
374
-
375
-
376
-
377
-
378
-
379
-
380
-
381
-
382
-
383
-
384
-
385
-
386
-
387
-
388
-
389
-
390
-
391
-
392
-
393
-
394
-
395
-
396
-
397
-
398
-
399
-
400
-
401
-
402
-
403
-
404
-
405
-
406
-
407
-
408
-
409
-
410
-
411
-
412
-
413
-
414
-
415
-
416
-
417
-
418
-
419
-
420
-
421
-
422
-
423
-
424
-
425
-
426
-
427
-
428
-
429
-
430
-
431
-
432
-
433
-
434
-
435
-
436
-
437
-
438
-
439
-
440
-
441
-
442
-
443
-
444
-
445
 |
 |

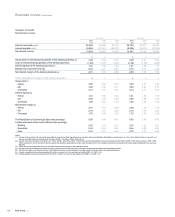
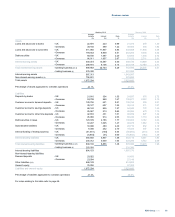
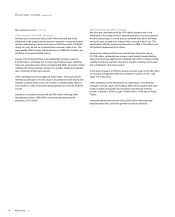
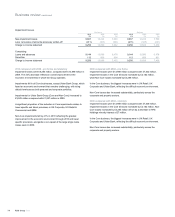
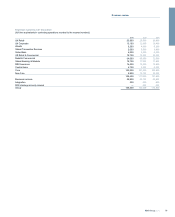
Non-interest income
Pro forma (1) Statutory
2010 2009 2008 2010 2009 2008
£m £m £m £m £m £m
Fees and commissions receivable 8,194 8,738 8,845 8,193 8,738 8,855
Fees and commissions payable (2,211) (2,790) (2,411) (2,211) (2,790) (2,444)
Income/(loss) from trading activities
-excluding Asset Protection Scheme credit default swap - fair
value changes 6,138 3,999 (9,084) 6,067 3,761 (9,025)
- Asset Protection Scheme credit default swap - fair value changes —— — (1,550) — —
Gain on redemption of own debt —— — 553 3,790 —
Other operating income 1,213 787 544 1,479 873 2,153
Non-interest income (excluding insurance net premium income) 13,334 10,734 (2,106) 12,531 14,372 (461)
Insurance net premium income 5,128 5,266 5,709 5,128 5,266 5,709
Total non-interest income 18,462 16,000 3,603 17,659 19,638 5,248
Note:
(1) Pro forma excludes fair value of own debt, gain on redemption of own debt, strategic disposals and Asset Protection Scheme credit default swap - fair value changes.
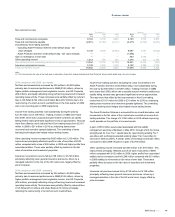
2010 compared with 2009 - pro forma
Net fees and commissions increased by £35 million to £5,983 million
primarily due to improved performance in GBM (£160 million), driven by
higher portfolio management and origination income, and UK Corporate
(£94 million), principally reflecting strong refinancing levels and increased
operating lease activity. These increases were partially offset by reduced
fees in UK Retail (£144 million) and Ulster Bank (£72 million) due to the
restructuring of current account overdraft fees in the final quarter of 2009
and a non-recurring gain in 2009 respectively.
Income from trading activities rose substantially during the year by
£2,139 million to £6,138 million. Trading revenues in GBM were lower
than 2009, which saw unusually buoyant market conditions as rapidly
falling interest rates generated significant revenue opportunities. This was
more than offset by much reduced Non-Core trading losses from £5,161
million in 2009 to £31 million in 2010 as underlying asset prices
recovered and monoline spreads tightened. The unwinding of some
banking book hedges also helped reduce trading losses.
Other operating income increased by £426 million to £1,213 million. This
improvement principally reflected a profit on sale of securities of £533
million compared with a loss of £55 million in 2009 and higher profits from
associated entities. These were partially offset by declines in the fair
value of securities and investment properties.
Insurance net premium income fell by £138 million to £5,128 million
principally reflecting lower general insurance premiums, driven by a
managed reduction in the risk of the UK motor book, largely offset by
price increases.
2010 compared with 2009 - statutory
Net fees and commissions increased by £34 million to £5,982 million
primarily due to improved performance in GBM (£160 million), driven by
higher portfolio management and origination income, and UK Corporate
(£94 million), principally reflecting strong refinancing levels and increased
operating lease activity This increase was partially offset by reduced fees
in UK Retail (£144 million) and Ulster Bank (£72 million) principally
reflecting the restructuring of current account overdraft fees.
Income from trading activities, excluding fair value movements in the
Asset Protection Scheme credit default swap, rose substantially during
the year by £2,306 million to £6,067 million. Trading revenues in GBM
were lower than 2009, which saw unusually buoyant market conditions as
rapidly falling interest rates generated significant revenue opportunities.
This was more than offset by the improvement in Non-Core trading
losses from £5,161 million for 2009 to £31 million for 2010 as underlying
asset prices recovered and monoline spreads tightened. The unwinding
of some banking book hedges also helped reduce trading losses.
The Asset Protection Scheme is accounted for as a credit derivative, and
movements in the fair value of the contract are recorded as income from
trading activities. The charge of £1,550 million in 2010 reflects improving
credit spreads on the portfolio of covered assets.
Again of £553 million was booked associated with the liability
management exercise undertaken in May 2010, through which the Group
strengthened its Core Tier 1 capital base by repurchasing existing Tier 1
securities and exchanging selected existing Upper Tier 2 securities for
new senior debt securities. A similar series of exchange and tender offers
concluded in April 2009 resulted in a gain of £3,790 million.
Other operating income increased by £606 million to £1,479 million. This
improvement principally reflected a profit on sale of securities of £496
million compared with £162 million in 2009, higher profits from associated
entities and an increased credit of £249 million compared with £51 million
in 2009 relating to movements in fair value of own debt. These were
partially offset by losses in the fair value of securities and investment
properties.
Insurance net premium income fell by £138 million to £5,128 million
principally reflecting lower general insurance premiums, driven by a
managed reduction in the risk of the UK motor book, largely offset by
price increases.
69RBS Group 2010
Business review