RBS 2010 Annual Report Download - page 206
Download and view the complete annual report
Please find page 206 of the 2010 RBS annual report below. You can navigate through the pages in the report by either clicking on the pages listed below, or by using the keyword search tool below to find specific information within the annual report.-
 1
1 -
2
-
3
-
4
-
5
-
6
-
7
-
8
-
9
-
10
-
11
-
12
-
13
-
14
-
15
-
16
-
17
-
18
-
19
-
20
-
21
-
22
-
23
-
24
-
25
-
26
-
27
-
28
-
29
-
30
-
31
-
32
-
33
-
34
-
35
-
36
-
37
-
38
-
39
-
40
-
41
-
42
-
43
-
44
-
45
-
46
-
47
-
48
-
49
-
50
-
51
-
52
-
53
-
54
-
55
-
56
-
57
-
58
-
59
-
60
-
61
-
62
-
63
-
64
-
65
-
66
-
67
-
68
-
69
-
70
-
71
-
72
-
73
-
74
-
75
-
76
-
77
-
78
-
79
-
80
-
81
-
82
-
83
-
84
-
85
-
86
-
87
-
88
-
89
-
90
-
91
-
92
-
93
-
94
-
95
-
96
-
97
-
98
-
99
-
100
-
101
-
102
-
103
-
104
-
105
-
106
-
107
-
108
-
109
-
110
-
111
-
112
-
113
-
114
-
115
-
116
-
117
-
118
-
119
-
120
-
121
-
122
-
123
-
124
-
125
-
126
-
127
-
128
-
129
-
130
-
131
-
132
-
133
-
134
-
135
-
136
-
137
-
138
-
139
-
140
-
141
-
142
-
143
-
144
-
145
-
146
-
147
-
148
-
149
-
150
-
151
-
152
-
153
-
154
-
155
-
156
-
157
-
158
-
159
-
160
-
161
-
162
-
163
-
164
-
165
-
166
-
167
-
168
-
169
-
170
-
171
-
172
-
173
-
174
-
175
-
176
-
177
-
178
-
179
-
180
-
181
-
182
-
183
-
184
-
185
-
186
-
187
-
188
-
189
-
190
-
191
-
192
-
193
-
194
-
195
-
 196
196 -
 197
197 -
 198
198 -
 199
199 -
 200
200 -
 201
201 -
 202
202 -
 203
203 -
 204
204 -
 205
205 -
 206
206 -
 207
207 -
 208
208 -
 209
209 -
 210
210 -
 211
211 -
 212
212 -
 213
213 -
 214
214 -
 215
215 -
 216
216 -
217
-
218
-
219
-
220
-
221
-
222
-
223
-
224
-
225
-
226
-
227
-
228
-
229
-
230
-
231
-
232
-
233
-
234
-
235
-
236
-
237
-
238
-
239
-
240
-
241
-
242
-
243
-
244
-
245
-
246
-
247
-
248
-
249
-
250
-
251
-
252
-
253
-
254
-
255
-
256
-
257
-
258
-
259
-
260
-
261
-
262
-
263
-
264
-
265
-
266
-
267
-
268
-
269
-
270
-
271
-
272
-
273
-
274
-
275
-
276
-
277
-
278
-
279
-
280
-
281
-
282
-
283
-
284
-
285
-
286
-
287
-
288
-
289
-
290
-
291
-
292
-
293
-
294
-
295
-
296
-
297
-
298
-
299
-
300
-
301
-
302
-
303
-
304
-
305
-
306
-
307
-
308
-
309
-
310
-
311
-
312
-
313
-
314
-
315
-
316
-
317
-
318
-
319
-
320
-
321
-
322
-
323
-
324
-
325
-
326
-
327
-
328
-
329
-
330
-
331
-
332
-
333
-
334
-
335
-
336
-
337
-
338
-
339
-
340
-
341
-
342
-
343
-
344
-
345
-
346
-
347
-
348
-
349
-
350
-
351
-
352
-
353
-
354
-
355
-
356
-
357
-
358
-
359
-
360
-
361
-
362
-
363
-
364
-
365
-
366
-
367
-
368
-
369
-
370
-
371
-
372
-
373
-
374
-
375
-
376
-
377
-
378
-
379
-
380
-
381
-
382
-
383
-
384
-
385
-
386
-
387
-
388
-
389
-
390
-
391
-
392
-
393
-
394
-
395
-
396
-
397
-
398
-
399
-
400
-
401
-
402
-
403
-
404
-
405
-
406
-
407
-
408
-
409
-
410
-
411
-
412
-
413
-
414
-
415
-
416
-
417
-
418
-
419
-
420
-
421
-
422
-
423
-
424
-
425
-
426
-
427
-
428
-
429
-
430
-
431
-
432
-
433
-
434
-
435
-
436
-
437
-
438
-
439
-
440
-
441
-
442
-
443
-
444
-
445
 |
 |

Risk management: Other risk exposures
All the disclosures in this section (pages 204 to 220) are audited unless otherwise indicated with an asterisk (*).
Explanatory note
These disclosures provide information on certain elements of the Group's credit market activities, the majority of which are in Non-Core and, to a lesser
extent, Global Banking & Markets, US Retail & Commercial and Group Treasury. For credit valuation adjustments (CVA), leveraged finance and
conduits disclosures, the information presented has been analysed between the Group's Core and Non-Core businesses.
Definitions of acronyms used in this section can be found in the Glossary on pages 434 to 439.
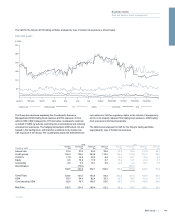
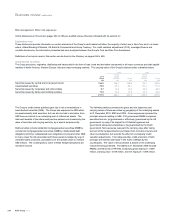
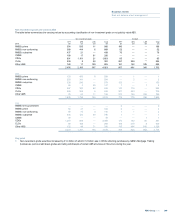
Asset-backed securities
The Group structures, originates, distributes and trades debt in the form of loan, bond and derivative instruments in all major currencies and debt capital
markets in North America, Western Europe, Asia and major emerging markets. The carrying value of the Group's debt securities is detailed below.
2009 2008
2010
Group
Group
before
RFS MI Group
Group
before
RFS MI Group
£bn £bn £bn £bn £bn
Securities issued by central and local governments 124.0 134.1 146.9 95.1 105.8
Asset-backed securities 70.8 87.6 88.1 111.1 111.1
Securities issued by corporates and other entities 9.7 13.4 14.4 24.3 26.2
Securities issued by banks and building societies 13.0 14.0 17.8 22.7 24.4
217.5 249.1 267.2 253.2 267.5
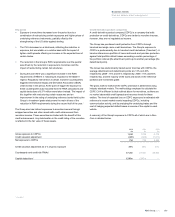
The Group’s credit market activities gave rise to risk concentrations in
asset-backed securities (ABS). The Group has exposures to ABS which
are predominantly debt securities, but can also be held in derivative form.
ABS have an interest in an underlying pool of referenced assets. The
risks and rewards of the referenced pool are passed onto investors by the
issue of securities with varying seniority, by a special purpose entity.
Debt securities include residential mortgage-backed securities (RMBS),
commercial mortgage-backed securities (CMBS), collateralised debt
obligations (CDOs), collateralised loan obligations (CLOs) and other ABS.
In many cases the risk associated with these assets is hedged by way of
credit derivative protection, purchased over the specific asset or relevant
ABS indices. The counterparty to some of these hedge transactions are
monoline insurers.
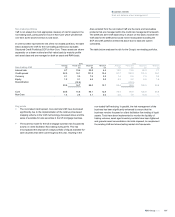
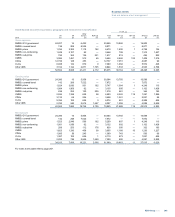
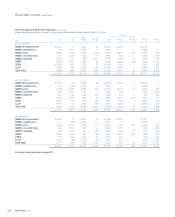
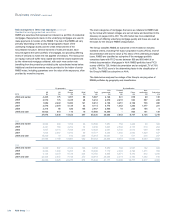
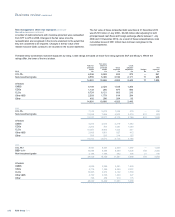
The following tables summarise the gross and net exposures and
carrying values of these securities by geography of the underlying assets
at 31 December 2010, 2009 and 2008. Gross exposures represent the
principal amounts relating to ABS. G10 government RMBS comprises
securities that are: (a) guaranteed or effectively guaranteed by the US
government, by way of its support for US federal agencies and
government sponsored enterprises or (b) guaranteed by the Dutch
government. Net exposures represent the carrying value after taking
account of the hedge protection purchased from monoline insurers and
other counterparties, but exclude the effect of counterparty credit
valuation adjustments. The hedge provides credit protection of both
principal and interest cash flows in the event of default by the
counterparty. The value of this protection is based on the underlying
instrument being protected. The tables at 31 December 2009 exclude
RMBS covered bonds in RFS MI, comprising gross exposure - £558
million, carrying value - £579 million, and net exposure - £579 million.
RBS Group 2010204
Business review continued