RBS 2010 Annual Report Download - page 161
Download and view the complete annual report
Please find page 161 of the 2010 RBS annual report below. You can navigate through the pages in the report by either clicking on the pages listed below, or by using the keyword search tool below to find specific information within the annual report.-
 1
1 -
2
-
3
-
4
-
5
-
6
-
7
-
8
-
9
-
10
-
11
-
12
-
13
-
14
-
15
-
16
-
17
-
18
-
19
-
20
-
21
-
22
-
23
-
24
-
25
-
26
-
27
-
28
-
29
-
30
-
31
-
32
-
33
-
34
-
35
-
36
-
37
-
38
-
39
-
40
-
41
-
42
-
43
-
44
-
45
-
46
-
47
-
48
-
49
-
50
-
51
-
52
-
53
-
54
-
55
-
56
-
57
-
58
-
59
-
60
-
61
-
62
-
63
-
64
-
65
-
66
-
67
-
68
-
69
-
70
-
71
-
72
-
73
-
74
-
75
-
76
-
77
-
78
-
79
-
80
-
81
-
82
-
83
-
84
-
85
-
86
-
87
-
88
-
89
-
90
-
91
-
92
-
93
-
94
-
95
-
96
-
97
-
98
-
99
-
100
-
101
-
102
-
103
-
104
-
105
-
106
-
107
-
108
-
109
-
110
-
111
-
112
-
113
-
114
-
115
-
116
-
117
-
118
-
119
-
120
-
121
-
122
-
123
-
124
-
125
-
126
-
127
-
128
-
129
-
130
-
131
-
132
-
133
-
134
-
135
-
136
-
137
-
138
-
139
-
140
-
141
-
142
-
143
-
144
-
145
-
146
-
147
-
148
-
149
-
150
-
 151
151 -
 152
152 -
 153
153 -
 154
154 -
 155
155 -
 156
156 -
 157
157 -
 158
158 -
 159
159 -
 160
160 -
 161
161 -
 162
162 -
 163
163 -
 164
164 -
 165
165 -
 166
166 -
 167
167 -
 168
168 -
 169
169 -
 170
170 -
 171
171 -
172
-
173
-
174
-
175
-
176
-
177
-
178
-
179
-
180
-
181
-
182
-
183
-
184
-
185
-
186
-
187
-
188
-
189
-
190
-
191
-
192
-
193
-
194
-
195
-
196
-
197
-
198
-
199
-
200
-
201
-
202
-
203
-
204
-
205
-
206
-
207
-
208
-
209
-
210
-
211
-
212
-
213
-
214
-
215
-
216
-
217
-
218
-
219
-
220
-
221
-
222
-
223
-
224
-
225
-
226
-
227
-
228
-
229
-
230
-
231
-
232
-
233
-
234
-
235
-
236
-
237
-
238
-
239
-
240
-
241
-
242
-
243
-
244
-
245
-
246
-
247
-
248
-
249
-
250
-
251
-
252
-
253
-
254
-
255
-
256
-
257
-
258
-
259
-
260
-
261
-
262
-
263
-
264
-
265
-
266
-
267
-
268
-
269
-
270
-
271
-
272
-
273
-
274
-
275
-
276
-
277
-
278
-
279
-
280
-
281
-
282
-
283
-
284
-
285
-
286
-
287
-
288
-
289
-
290
-
291
-
292
-
293
-
294
-
295
-
296
-
297
-
298
-
299
-
300
-
301
-
302
-
303
-
304
-
305
-
306
-
307
-
308
-
309
-
310
-
311
-
312
-
313
-
314
-
315
-
316
-
317
-
318
-
319
-
320
-
321
-
322
-
323
-
324
-
325
-
326
-
327
-
328
-
329
-
330
-
331
-
332
-
333
-
334
-
335
-
336
-
337
-
338
-
339
-
340
-
341
-
342
-
343
-
344
-
345
-
346
-
347
-
348
-
349
-
350
-
351
-
352
-
353
-
354
-
355
-
356
-
357
-
358
-
359
-
360
-
361
-
362
-
363
-
364
-
365
-
366
-
367
-
368
-
369
-
370
-
371
-
372
-
373
-
374
-
375
-
376
-
377
-
378
-
379
-
380
-
381
-
382
-
383
-
384
-
385
-
386
-
387
-
388
-
389
-
390
-
391
-
392
-
393
-
394
-
395
-
396
-
397
-
398
-
399
-
400
-
401
-
402
-
403
-
404
-
405
-
406
-
407
-
408
-
409
-
410
-
411
-
412
-
413
-
414
-
415
-
416
-
417
-
418
-
419
-
420
-
421
-
422
-
423
-
424
-
425
-
426
-
427
-
428
-
429
-
430
-
431
-
432
-
433
-
434
-
435
-
436
-
437
-
438
-
439
-
440
-
441
-
442
-
443
-
444
-
445
 |
 |

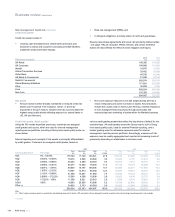
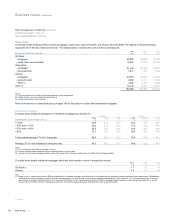
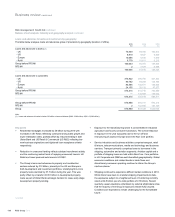
Retail credit assets: UK residential mortgages
Key points
xThe UK mortgage portfolio totalled £92.6 billion at 31 December
2010, an increase of 8% from 31 December 2009, due to continued
strong sales growth and lower redemption rates in historical terms.
Of the total portfolio, 98% is designated as Core business with the
primary brands being the Royal Bank of Scotland, NatWest, the One
Account and First Active (Non-Core is made up of Direct Line
Mortgages). The assets comprise prime mortgage lending and
include 6.8% (£6.2 billion) of exposure to residential buy-to-let at 31
December 2010. There is a small legacy self certification book
(0.3% of total assets); which was withdrawn from sale in 2004.
xGross new mortgage lending in 2010 was strong at £15.9 billion.
The average LTV for new business during 2010 was 64.2%
compared with 67.2% in 2009. The maximum LTV available to new
customers remains at 90%. Based on the Halifax House Price index
as at September 2010, the book averaged indexed LTV has reduced
to 58.2% at 31 December 2010 from 59.1% at 31 December 2009
influenced by favourable house price movements with the proportion
of balances in negative equity at 31 December 2010 standing at
6.9% down from 10.9% at 31 December 2009.
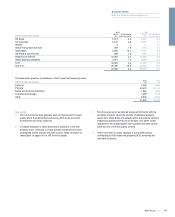
xThe arrears rate (more than 3 payments in arrears, excluding
repossessions and shortfalls post property sale) increased slightly to
1.7% at 31 December 2010 from 1.6% at 31 December 2009. After
aperiod of deterioration the arrears rate has stabilised and has
remained broadly stable since late 2009. The arrears rate on the
buy-to-let portfolio was 1.3 % at 31 December 2010 (2009 - 1.4%).
xThe mortgage impairment charge was £183 million for the year
ended 31 December 2010 compared to £129 million for 2009, with a
proportion of the 2010 charge (approximately £70 million) being the
result of adjustments reflecting reduced expectations of recovery on
prior period defaulted debt and refinement of provision methodology.
Underlying default trends improved throughout 2010 when
compared with 2009. Provisions as a percentage of loans and
receivables have increased to 0.37% at 31 December 2010
compared with 0.25% at 31 December 2009. Default and arrears
rates remain sensitive to economic developments and are currently
supported by the low interest rate environment and strong book
growth with recent business yet to mature.
xAnumber of initiatives aimed at supporting customers experiencing
temporary financial difficulties remain in place. Forbearance
activities include offering reduced or deferred payment terms on a
temporary basis for a period of up to 12 months during which arrears
continue to accrue on the account. Forbearance activities in the
performing book amounted to £0.6 billion during 2010. It is Group
policy not to initiate repossession proceedings for at least six
months after arrears are evident. The number of properties
repossessed in 2010 was 1,392 compared to 1,251 in 2009.
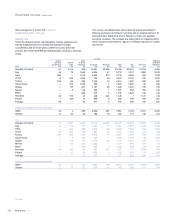
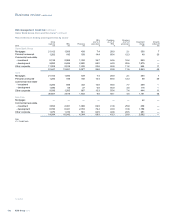
Citizens real estate
Key points
xCitizens total residential real estate portfolio totalled $38.2 billion at
31 December 2010 (2009 - $42.5 billion). The real estate portfolio
comprises $9.7 billion (Core: $8.6 billion; Non-Core: $1.1 billion) of
first lien residential mortgages and $28.5 billion (Core: $23.7 billion;
Non-Core: $4.8 billion) of home equity loans and lines (first and
second lien). Home Equity Core consists of 46% first lien position
while Non-Core consists of 97% second lien position. The Core
business comprises 84% of the portfolio and Non-Core comprising
16%, with the serviced by others (SBO) portfolio being the largest
component at 75% of the Non-Core portfolio.
xCitizens continue to focus primarily on the ‘footprint states’ of New
England, Mid-Atlantic and Mid-West targeting low risk products and
maintaining conservative risk policies. Loan acceptance criteria were
tightened during 2009 to address deteriorating economic and market
conditions. As at 31 December 2010, the portfolio consisted of $31.5
billion (82% of the total portfolio) in these footprint states.
xThe SBO portfolio is part of Non-Core and consists of purchased
pools of home equity loans and lines (96% second lien) with current
LTV (105%) and geographic profiles (73% outside of Citizens
footprint) leading to an annualised charge-off rate of 10.6% in 2010.
The SBO book has been closed to new purchases since the third
quarter of 2007 and is in run-off, with exposure down from $5.5
billion at 31 December 2009 to $4.5 billion at 31 December 2010.
The arrears rate of the SBO portfolio decreased from 3.1% at 31
December 2009 to 2.7% at 31 December 2010 due to more effective
account servicing and collections, following a service conversion in
2009.
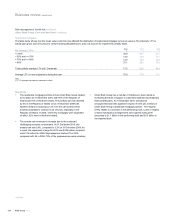
xThe current weighted average LTV of the real estate portfolio
increased slightly from 74.5% at 31 December 2009 to 75.3% at 31
December 2010, driven by a down turn in home prices. The current
weighted average LTV of the real estate portfolio excluding SBO is
70.0%.
xThe arrears rate decreased slightly from 1.5% at 31 December 2009
to 1.4% at 31 December 2010. Delinquency rates have stabilised in
recent months for both residential mortgages and home equity loans
and lines. Citizens’ participates in the US Government Home
Affordable Modification Program (HAMP) alongside other bank
sponsored initiatives. Under HAMP, any borrower requesting a
modification must be first reviewed to see if they meet the criteria of
this programme. If the borrower does not qualify for HAMP, then
they are reviewed for internal modification programmes. The HAMP
programme is available only for first lien loans to owner-occupied.
All second lien home equity lines and loans are modified using
internal programmes.
xThe cumulative effect of these arrangements has helped the
Group’s customers. Modified loan balances were $566 million at 31
December 2010 (2009 - $235 million).
159RBS Group 2010
Business review
Risk and balance sheet management