RBS 2010 Annual Report Download - page 198
Download and view the complete annual report
Please find page 198 of the 2010 RBS annual report below. You can navigate through the pages in the report by either clicking on the pages listed below, or by using the keyword search tool below to find specific information within the annual report.-
 1
1 -
2
-
3
-
4
-
5
-
6
-
7
-
8
-
9
-
10
-
11
-
12
-
13
-
14
-
15
-
16
-
17
-
18
-
19
-
20
-
21
-
22
-
23
-
24
-
25
-
26
-
27
-
28
-
29
-
30
-
31
-
32
-
33
-
34
-
35
-
36
-
37
-
38
-
39
-
40
-
41
-
42
-
43
-
44
-
45
-
46
-
47
-
48
-
49
-
50
-
51
-
52
-
53
-
54
-
55
-
56
-
57
-
58
-
59
-
60
-
61
-
62
-
63
-
64
-
65
-
66
-
67
-
68
-
69
-
70
-
71
-
72
-
73
-
74
-
75
-
76
-
77
-
78
-
79
-
80
-
81
-
82
-
83
-
84
-
85
-
86
-
87
-
88
-
89
-
90
-
91
-
92
-
93
-
94
-
95
-
96
-
97
-
98
-
99
-
100
-
101
-
102
-
103
-
104
-
105
-
106
-
107
-
108
-
109
-
110
-
111
-
112
-
113
-
114
-
115
-
116
-
117
-
118
-
119
-
120
-
121
-
122
-
123
-
124
-
125
-
126
-
127
-
128
-
129
-
130
-
131
-
132
-
133
-
134
-
135
-
136
-
137
-
138
-
139
-
140
-
141
-
142
-
143
-
144
-
145
-
146
-
147
-
148
-
149
-
150
-
151
-
152
-
153
-
154
-
155
-
156
-
157
-
158
-
159
-
160
-
161
-
162
-
163
-
164
-
165
-
166
-
167
-
168
-
169
-
170
-
171
-
172
-
173
-
174
-
175
-
176
-
177
-
178
-
179
-
180
-
181
-
182
-
183
-
184
-
185
-
186
-
187
-
 188
188 -
 189
189 -
 190
190 -
 191
191 -
 192
192 -
 193
193 -
 194
194 -
 195
195 -
 196
196 -
 197
197 -
 198
198 -
 199
199 -
 200
200 -
 201
201 -
 202
202 -
 203
203 -
 204
204 -
 205
205 -
 206
206 -
 207
207 -
 208
208 -
209
-
210
-
211
-
212
-
213
-
214
-
215
-
216
-
217
-
218
-
219
-
220
-
221
-
222
-
223
-
224
-
225
-
226
-
227
-
228
-
229
-
230
-
231
-
232
-
233
-
234
-
235
-
236
-
237
-
238
-
239
-
240
-
241
-
242
-
243
-
244
-
245
-
246
-
247
-
248
-
249
-
250
-
251
-
252
-
253
-
254
-
255
-
256
-
257
-
258
-
259
-
260
-
261
-
262
-
263
-
264
-
265
-
266
-
267
-
268
-
269
-
270
-
271
-
272
-
273
-
274
-
275
-
276
-
277
-
278
-
279
-
280
-
281
-
282
-
283
-
284
-
285
-
286
-
287
-
288
-
289
-
290
-
291
-
292
-
293
-
294
-
295
-
296
-
297
-
298
-
299
-
300
-
301
-
302
-
303
-
304
-
305
-
306
-
307
-
308
-
309
-
310
-
311
-
312
-
313
-
314
-
315
-
316
-
317
-
318
-
319
-
320
-
321
-
322
-
323
-
324
-
325
-
326
-
327
-
328
-
329
-
330
-
331
-
332
-
333
-
334
-
335
-
336
-
337
-
338
-
339
-
340
-
341
-
342
-
343
-
344
-
345
-
346
-
347
-
348
-
349
-
350
-
351
-
352
-
353
-
354
-
355
-
356
-
357
-
358
-
359
-
360
-
361
-
362
-
363
-
364
-
365
-
366
-
367
-
368
-
369
-
370
-
371
-
372
-
373
-
374
-
375
-
376
-
377
-
378
-
379
-
380
-
381
-
382
-
383
-
384
-
385
-
386
-
387
-
388
-
389
-
390
-
391
-
392
-
393
-
394
-
395
-
396
-
397
-
398
-
399
-
400
-
401
-
402
-
403
-
404
-
405
-
406
-
407
-
408
-
409
-
410
-
411
-
412
-
413
-
414
-
415
-
416
-
417
-
418
-
419
-
420
-
421
-
422
-
423
-
424
-
425
-
426
-
427
-
428
-
429
-
430
-
431
-
432
-
433
-
434
-
435
-
436
-
437
-
438
-
439
-
440
-
441
-
442
-
443
-
444
-
445
 |
 |

Risk management: Market risk continued
Traded portfolios continued
Key points
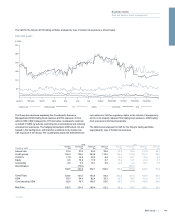
xThe Group’s period end VaR reduced as the exceptional volatility
of the market data from the period of the financial crisis dropped
out of the 500 days of time series data used in the VaR
calculation. The credit spread VaR was particularly impacted as a
result of this effect.
xThe Group’s maximum and average credit and Non-Core VaR
were higher in 2010 than in 2009 due to Non-Core exiting several
highly structured positions which, due to their complexity and
layering, required unwinding with different counterparties over
different periods. The timing of the unwind led to an increased
VaR, until the exit was completed in October and the VaR then
reduced back to the levels held earlier in the year.
xCEM VaR was greater in 2010 than 2009 due to the novation of
counterparty risk hedging trades from RBS N.V. to RBS plc. For
RBS N.V. there is no local regulatory requirement for counterparty
hedges to be included in VaR, as they are treated on a
standardised basis but on novation to CEM in RBS plc, under UK
regulatory requirements, the trades were captured by the VaR
model resulting in an increase in VaR.
xCEM trading VaR also increased as a consequence of the
implementation of a discounting approach based on the real
funding cost for the collateralised derivatives.
xCommodity VaR decreased during the year since a significant
part of the Group’s interest in RBS Sempra Commodities JV was
sold during the year.
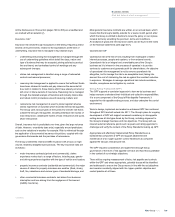
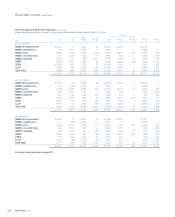
GBM traded revenue*
RBS Group 2010196
Business review continued
2
Number of trading days
232
7
11
19
11
26
18
22
17
13
9
7
9 9
4
6
323
12
3
20
13
(20) >< (15)
(15) >< (10)
(10) >< (5)
(5) >< 0
0 >< 5
5 >< 10
10 >< 15
15 >< 20
20 >< 25
25 >< 30
30 >< 35
35 >< 40
40 >< 45
45 >< 50
50 >< 55
55 >< 60
60 >< 65
65 >< 70
70 >< 75
75 >< 80
80 >< 85
85 >< 90
90 >< 95
95 >< 100
> 100
(20)
0
5
10
15
20
25
30
35
40
2010
GBP £m
2009
GBP £m
Key points*
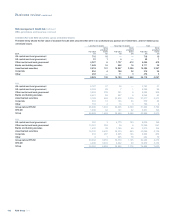
xThe average daily revenue earned from GBM’s trading, balance
sheet management and other trading activities in 2010 was £25.4
million compared with £37.8 million in 2009. The standard deviation
of these daily revenues was £22.0 million compared with £32.3
million in 2009. The standard deviation measures the variation of
daily revenues about the mean value of those revenues.
xAn analysis of the frequency distribution of daily revenue shows that
there were 22 days with negative revenue during 2010 compared
with 16 days in 2009. The most frequent result is daily revenue of
between £25 million and £30 million with 37 occurrences in 2010
compared with 26 occurrences in 2009.
xThe effect of any month end adjustments, not attributable to a
specific daily market move, is spread evenly over the days in the
month in question.
xThe graph of daily revenues for 2010 shows a narrower distribution
of revenues compared with 2009.
*unaudited
0
(20) >< (15)
(15) >< (10)
(10) >< (5)
(5) >< 0
0 >< 5
5 >< 10
10 >< 15
15 >< 20
20 >< 25
25 >< 30
30 >< 35
35 >< 40
40 >< 45
45 >< 50
50 >< 55
55 >< 60
60 >< 65
65 >< 70
70 >< 75
75 >< 80
80 >< 85
85 >< 90
90 >< 95
95 >< 100
> 100
(20)
5
10
432
4
9
13
21 22
37
20
16
13
10
545
21
32111
2
27
25
Number of trading days
15
20
25
30
35
40