RBS 2010 Annual Report Download - page 286
Download and view the complete annual report
Please find page 286 of the 2010 RBS annual report below. You can navigate through the pages in the report by either clicking on the pages listed below, or by using the keyword search tool below to find specific information within the annual report.-
 1
1 -
2
-
3
-
4
-
5
-
6
-
7
-
8
-
9
-
10
-
11
-
12
-
13
-
14
-
15
-
16
-
17
-
18
-
19
-
20
-
21
-
22
-
23
-
24
-
25
-
26
-
27
-
28
-
29
-
30
-
31
-
32
-
33
-
34
-
35
-
36
-
37
-
38
-
39
-
40
-
41
-
42
-
43
-
44
-
45
-
46
-
47
-
48
-
49
-
50
-
51
-
52
-
53
-
54
-
55
-
56
-
57
-
58
-
59
-
60
-
61
-
62
-
63
-
64
-
65
-
66
-
67
-
68
-
69
-
70
-
71
-
72
-
73
-
74
-
75
-
76
-
77
-
78
-
79
-
80
-
81
-
82
-
83
-
84
-
85
-
86
-
87
-
88
-
89
-
90
-
91
-
92
-
93
-
94
-
95
-
96
-
97
-
98
-
99
-
100
-
101
-
102
-
103
-
104
-
105
-
106
-
107
-
108
-
109
-
110
-
111
-
112
-
113
-
114
-
115
-
116
-
117
-
118
-
119
-
120
-
121
-
122
-
123
-
124
-
125
-
126
-
127
-
128
-
129
-
130
-
131
-
132
-
133
-
134
-
135
-
136
-
137
-
138
-
139
-
140
-
141
-
142
-
143
-
144
-
145
-
146
-
147
-
148
-
149
-
150
-
151
-
152
-
153
-
154
-
155
-
156
-
157
-
158
-
159
-
160
-
161
-
162
-
163
-
164
-
165
-
166
-
167
-
168
-
169
-
170
-
171
-
172
-
173
-
174
-
175
-
176
-
177
-
178
-
179
-
180
-
181
-
182
-
183
-
184
-
185
-
186
-
187
-
188
-
189
-
190
-
191
-
192
-
193
-
194
-
195
-
196
-
197
-
198
-
199
-
200
-
201
-
202
-
203
-
204
-
205
-
206
-
207
-
208
-
209
-
210
-
211
-
212
-
213
-
214
-
215
-
216
-
217
-
218
-
219
-
220
-
221
-
222
-
223
-
224
-
225
-
226
-
227
-
228
-
229
-
230
-
231
-
232
-
233
-
234
-
235
-
236
-
237
-
238
-
239
-
240
-
241
-
242
-
243
-
244
-
245
-
246
-
247
-
248
-
249
-
250
-
251
-
252
-
253
-
254
-
255
-
256
-
257
-
258
-
259
-
260
-
261
-
262
-
263
-
264
-
265
-
266
-
267
-
268
-
269
-
270
-
271
-
272
-
273
-
274
-
275
-
 276
276 -
 277
277 -
 278
278 -
 279
279 -
 280
280 -
 281
281 -
 282
282 -
 283
283 -
 284
284 -
 285
285 -
 286
286 -
 287
287 -
 288
288 -
 289
289 -
 290
290 -
 291
291 -
 292
292 -
 293
293 -
 294
294 -
 295
295 -
 296
296 -
297
-
298
-
299
-
300
-
301
-
302
-
303
-
304
-
305
-
306
-
307
-
308
-
309
-
310
-
311
-
312
-
313
-
314
-
315
-
316
-
317
-
318
-
319
-
320
-
321
-
322
-
323
-
324
-
325
-
326
-
327
-
328
-
329
-
330
-
331
-
332
-
333
-
334
-
335
-
336
-
337
-
338
-
339
-
340
-
341
-
342
-
343
-
344
-
345
-
346
-
347
-
348
-
349
-
350
-
351
-
352
-
353
-
354
-
355
-
356
-
357
-
358
-
359
-
360
-
361
-
362
-
363
-
364
-
365
-
366
-
367
-
368
-
369
-
370
-
371
-
372
-
373
-
374
-
375
-
376
-
377
-
378
-
379
-
380
-
381
-
382
-
383
-
384
-
385
-
386
-
387
-
388
-
389
-
390
-
391
-
392
-
393
-
394
-
395
-
396
-
397
-
398
-
399
-
400
-
401
-
402
-
403
-
404
-
405
-
406
-
407
-
408
-
409
-
410
-
411
-
412
-
413
-
414
-
415
-
416
-
417
-
418
-
419
-
420
-
421
-
422
-
423
-
424
-
425
-
426
-
427
-
428
-
429
-
430
-
431
-
432
-
433
-
434
-
435
-
436
-
437
-
438
-
439
-
440
-
441
-
442
-
443
-
444
-
445
 |
 |
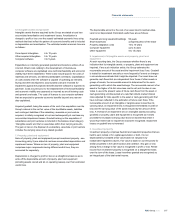
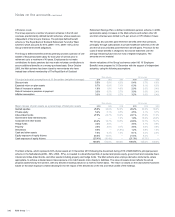
Pensions
The Group operates a number of defined benefit pension schemes as
described in Note 4 on the accounts. The assets of the schemes are
measured at their fair value at the balance sheet date. Scheme liabilities
are measured using the projected unit method, which takes account of
projected earnings increases, using actuarial assumptions that give the
best estimate of the future cash flows that will arise under the scheme
liabilities. These cash flows are discounted at the interest rate applicable
to high-quality corporate bonds of the same currency and term as the
liabilities. Any recognisable surplus or deficit of scheme assets over
liabilities is recognised in the balance sheet as an asset (surplus) or
liability (deficit).
In determining the value of scheme liabilities, financial and demographic
assumptions are made including price inflation, pension increases,
earnings growth and the longevity of scheme members. A range of
assumptions could be adopted in valuing the schemes' liabilities. Different
assumptions could significantly alter the amount of the surplus or deficit
recognised in the balance sheet and the pension cost charged to the
income statement. The assumptions adopted for the Group's pension
schemes are set out in Note 4 on the accounts, together with sensitivities
of the balance sheet and income statement to changes in those
assumptions.
Apension asset of £105 million and a liability of £2,288 million were
recognised in the balance sheet at 31 December 2010 (2009 - asset -
£58 million, liability - £2,963 million; 2008 - asset - £36 million, liability -
£2,032 million).
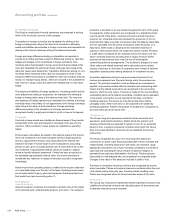
Fair value - financial instruments
Financial instruments classified as held-for-trading or designated as at
fair value through profit or loss and financial assets classified as
available-for-sale are recognised in the financial statements at fair value.
All derivatives are measured at fair value. Gains or losses arising from
changes in the fair value of financial instruments classified as held-for-
trading or designated as at fair value through profit or loss are included in
the income statement. Unrealised gains and losses on available-for-sale
financial assets are recognised directly in equity unless an impairment
loss is recognised.
Financial instruments measured at fair value include:
Loans and advances (held-for-trading and designated as at fair value
though profit or loss) - principally comprise reverse repurchase
agreements (reverse repos) and cash collateral.
Debt securities (held-for-trading, designated as at fair value though profit
or loss and available-for-sale) - debt securities include those issued by
governments, municipal bodies, mortgage agencies and financial
institutions as well as corporate bonds, debentures and residual interests
in securitisations.
Equity securities (held-for-trading, designated as at fair value though
profit or loss and available-for-sale) - comprise equity shares of
companies or corporations both listed and unlisted.
Deposits by banks and customer accounts (held-for-trading and
designated as at fair value though profit or loss) - deposits measured at
fair value principally include repurchase agreements (repos), cash
collateral and investment contracts issued by the Group's life assurance
businesses.
Debt securities in issue (held-for-trading and designated as at fair value
though profit or loss) - principally comprise medium term notes.
Short positions (held-for-trading) - arise in dealing and market making
activities where debt securities and equity shares are sold which the
Group does not currently possess.
Derivatives - these include swaps (currency swaps, interest rate swaps,
credit default swaps, total return swaps and equity and equity index
swaps), forward foreign exchange contracts, forward rate agreements,
futures (currency, interest rate and equity) and options (exchange-traded
options on currencies, interest rates and equities and equity indices and
OTC currency and equity options, interest rate caps and floors and
swaptions).
Fair value is the amount for which an asset could be exchanged, or a
liability settled, between knowledgeable, willing parties in an arm’s length
transaction. Fair values are determined from quoted prices in active
markets for identical financial assets or financial liabilities where these
are available. Fair value for a net open position in a financial instrument
in an active market is the number of units of the instrument held times the
current bid price (for financial assets) or offer price (for financial liabilities).
In determining the fair value of derivative financial instruments gross long
and short positions measured at current mid market prices are adjusted
by bid-offer reserves calculated on a portfolio basis. Credit valuation
adjustments are made when valuing derivative financial assets to
incorporate counterparty credit risk. Adjustments are also made when
valuing financial liabilities to reflect the Group’s own credit standing.
Where the market for a financial instrument is not active, fair value is
established using a valuation technique. These valuation techniques
involve a degree of estimation, the extent of which depends on the
instrument’s complexity and the availability of market-based data. More
details about the Group’s valuation methodologies and the sensitivity to
reasonably possible alternative assumptions of the fair value of financial
instruments valued using techniques where at least one significant input
is unobservable are given in Note 12 on pages 310 to 324.
RBS Group 2010284
Accounting policies continued