RBS 2010 Annual Report Download - page 94
Download and view the complete annual report
Please find page 94 of the 2010 RBS annual report below. You can navigate through the pages in the report by either clicking on the pages listed below, or by using the keyword search tool below to find specific information within the annual report.-
 1
1 -
2
-
3
-
4
-
5
-
6
-
7
-
8
-
9
-
10
-
11
-
12
-
13
-
14
-
15
-
16
-
17
-
18
-
19
-
20
-
21
-
22
-
23
-
24
-
25
-
26
-
27
-
28
-
29
-
30
-
31
-
32
-
33
-
34
-
35
-
36
-
37
-
38
-
39
-
40
-
41
-
42
-
43
-
44
-
45
-
46
-
47
-
48
-
49
-
50
-
51
-
52
-
53
-
54
-
55
-
56
-
57
-
58
-
59
-
60
-
61
-
62
-
63
-
64
-
65
-
66
-
67
-
68
-
69
-
70
-
71
-
72
-
73
-
74
-
75
-
76
-
77
-
78
-
79
-
80
-
81
-
82
-
83
-
 84
84 -
 85
85 -
 86
86 -
 87
87 -
 88
88 -
 89
89 -
 90
90 -
 91
91 -
 92
92 -
 93
93 -
 94
94 -
 95
95 -
 96
96 -
 97
97 -
 98
98 -
 99
99 -
 100
100 -
 101
101 -
 102
102 -
 103
103 -
 104
104 -
105
-
106
-
107
-
108
-
109
-
110
-
111
-
112
-
113
-
114
-
115
-
116
-
117
-
118
-
119
-
120
-
121
-
122
-
123
-
124
-
125
-
126
-
127
-
128
-
129
-
130
-
131
-
132
-
133
-
134
-
135
-
136
-
137
-
138
-
139
-
140
-
141
-
142
-
143
-
144
-
145
-
146
-
147
-
148
-
149
-
150
-
151
-
152
-
153
-
154
-
155
-
156
-
157
-
158
-
159
-
160
-
161
-
162
-
163
-
164
-
165
-
166
-
167
-
168
-
169
-
170
-
171
-
172
-
173
-
174
-
175
-
176
-
177
-
178
-
179
-
180
-
181
-
182
-
183
-
184
-
185
-
186
-
187
-
188
-
189
-
190
-
191
-
192
-
193
-
194
-
195
-
196
-
197
-
198
-
199
-
200
-
201
-
202
-
203
-
204
-
205
-
206
-
207
-
208
-
209
-
210
-
211
-
212
-
213
-
214
-
215
-
216
-
217
-
218
-
219
-
220
-
221
-
222
-
223
-
224
-
225
-
226
-
227
-
228
-
229
-
230
-
231
-
232
-
233
-
234
-
235
-
236
-
237
-
238
-
239
-
240
-
241
-
242
-
243
-
244
-
245
-
246
-
247
-
248
-
249
-
250
-
251
-
252
-
253
-
254
-
255
-
256
-
257
-
258
-
259
-
260
-
261
-
262
-
263
-
264
-
265
-
266
-
267
-
268
-
269
-
270
-
271
-
272
-
273
-
274
-
275
-
276
-
277
-
278
-
279
-
280
-
281
-
282
-
283
-
284
-
285
-
286
-
287
-
288
-
289
-
290
-
291
-
292
-
293
-
294
-
295
-
296
-
297
-
298
-
299
-
300
-
301
-
302
-
303
-
304
-
305
-
306
-
307
-
308
-
309
-
310
-
311
-
312
-
313
-
314
-
315
-
316
-
317
-
318
-
319
-
320
-
321
-
322
-
323
-
324
-
325
-
326
-
327
-
328
-
329
-
330
-
331
-
332
-
333
-
334
-
335
-
336
-
337
-
338
-
339
-
340
-
341
-
342
-
343
-
344
-
345
-
346
-
347
-
348
-
349
-
350
-
351
-
352
-
353
-
354
-
355
-
356
-
357
-
358
-
359
-
360
-
361
-
362
-
363
-
364
-
365
-
366
-
367
-
368
-
369
-
370
-
371
-
372
-
373
-
374
-
375
-
376
-
377
-
378
-
379
-
380
-
381
-
382
-
383
-
384
-
385
-
386
-
387
-
388
-
389
-
390
-
391
-
392
-
393
-
394
-
395
-
396
-
397
-
398
-
399
-
400
-
401
-
402
-
403
-
404
-
405
-
406
-
407
-
408
-
409
-
410
-
411
-
412
-
413
-
414
-
415
-
416
-
417
-
418
-
419
-
420
-
421
-
422
-
423
-
424
-
425
-
426
-
427
-
428
-
429
-
430
-
431
-
432
-
433
-
434
-
435
-
436
-
437
-
438
-
439
-
440
-
441
-
442
-
443
-
444
-
445
 |
 |

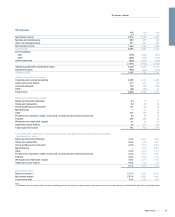
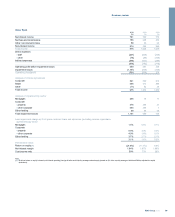
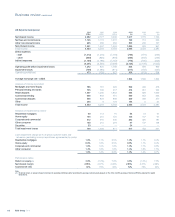
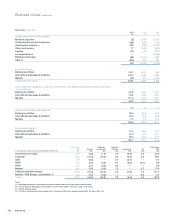
US Retail & Commercial
2010 2009 2008 2010 2009 2008
US$m US$m US$m £m £m £m
Net interest income 2,962 2,777 3,200 1,917 1,775 1,726
Net fees and commissions 1,126 1,119 1,231 729 714 664
Other non-interest income 465 368 362 300 235 197
Non-interest income 1,591 1,487 1,593 1,029 949 861
Total income 4,553 4,264 4,793 2,946 2,724 2,587
Direct expenses
- staff (1,212) (1,214) (1,194) (784) (776) (645)
- other (880) (929) (654) (569) (593) (354)
Indirect expenses (1,189) (1,196) (1,157) (770) (766) (623)
(3,281) (3,339) (3,005) (2,123) (2,135) (1,622)
Operating profit before impairment losses 1,272 925 1,788 823 589 965
Impairment losses (799) (1,099) (811) (517) (702) (437)
Operating profit/(loss) 473 (174) 977 306 (113) 528
Average exchange rate - US$/£ 1.546 1.566 1.853
Analysis of income by product
Mortgages and home equity 786 781 695 509 499 375
Personal lending and cards 735 706 617 476 451 333
Retail deposits 1,397 1,296 1,853 903 828 1,000
Commercial lending 896 848 751 580 542 405
Commercial deposits 495 624 698 320 398 377
Other 244 9 179 158 6 97
Total income 4,553 4,264 4,793 2,946 2,724 2,587
Analysis of impairment by sector
Residential mortgages 90 113 76 58 72 41
Home equity 194 261 125 126 167 67
Corporate and commercial 312 510 335 202 326 181
Other consumer 150 215 275 97 137 148
Securities 53 — — 34 ——
Total impairment losses 799 1,099 811 517 702 437
Loan impairment charge as % of gross customer loans and
advances (excluding reverse repurchase agreements) by sector
Residential mortgages 1.0% 1.1% 0.5% 1.0% 1.1% 0.4%
Home equity 0.8% 1.0% 0.5% 0.8% 1.1% 0.4%
Corporate and commercial 1.0% 1.6% 1.0% 1.0% 1.7% 0.8%
Other consumer 1.4% 1.8% 1.9% 1.4% 1.8% 1.5%
1.0% 1.4% 0.9% 1.0% 1.4% 0.7%
Performance ratios
Return on equity (1) 3.6% (1.3%) 7.9% 3.6% (1.3%) 7.8%
Net interest margin 2.85% 2.37% 2.68% 2.85% 2.37% 2.68%
Cost:income ratio 72% 78% 63% 72% 78% 63%
Note:
(1) Divisional return on equity is based on divisional operating profit/(loss) after tax divided by average notional equity (based on 9% of the monthly average of divisional RWAs, adjusted for capital
deductions).
RBS Group 201092
Business review continued