RBS 2010 Annual Report Download - page 218
Download and view the complete annual report
Please find page 218 of the 2010 RBS annual report below. You can navigate through the pages in the report by either clicking on the pages listed below, or by using the keyword search tool below to find specific information within the annual report.-
 1
1 -
2
-
3
-
4
-
5
-
6
-
7
-
8
-
9
-
10
-
11
-
12
-
13
-
14
-
15
-
16
-
17
-
18
-
19
-
20
-
21
-
22
-
23
-
24
-
25
-
26
-
27
-
28
-
29
-
30
-
31
-
32
-
33
-
34
-
35
-
36
-
37
-
38
-
39
-
40
-
41
-
42
-
43
-
44
-
45
-
46
-
47
-
48
-
49
-
50
-
51
-
52
-
53
-
54
-
55
-
56
-
57
-
58
-
59
-
60
-
61
-
62
-
63
-
64
-
65
-
66
-
67
-
68
-
69
-
70
-
71
-
72
-
73
-
74
-
75
-
76
-
77
-
78
-
79
-
80
-
81
-
82
-
83
-
84
-
85
-
86
-
87
-
88
-
89
-
90
-
91
-
92
-
93
-
94
-
95
-
96
-
97
-
98
-
99
-
100
-
101
-
102
-
103
-
104
-
105
-
106
-
107
-
108
-
109
-
110
-
111
-
112
-
113
-
114
-
115
-
116
-
117
-
118
-
119
-
120
-
121
-
122
-
123
-
124
-
125
-
126
-
127
-
128
-
129
-
130
-
131
-
132
-
133
-
134
-
135
-
136
-
137
-
138
-
139
-
140
-
141
-
142
-
143
-
144
-
145
-
146
-
147
-
148
-
149
-
150
-
151
-
152
-
153
-
154
-
155
-
156
-
157
-
158
-
159
-
160
-
161
-
162
-
163
-
164
-
165
-
166
-
167
-
168
-
169
-
170
-
171
-
172
-
173
-
174
-
175
-
176
-
177
-
178
-
179
-
180
-
181
-
182
-
183
-
184
-
185
-
186
-
187
-
188
-
189
-
190
-
191
-
192
-
193
-
194
-
195
-
196
-
197
-
198
-
199
-
200
-
201
-
202
-
203
-
204
-
205
-
206
-
207
-
 208
208 -
 209
209 -
 210
210 -
 211
211 -
 212
212 -
 213
213 -
 214
214 -
 215
215 -
 216
216 -
 217
217 -
 218
218 -
 219
219 -
 220
220 -
 221
221 -
 222
222 -
 223
223 -
 224
224 -
 225
225 -
 226
226 -
 227
227 -
 228
228 -
229
-
230
-
231
-
232
-
233
-
234
-
235
-
236
-
237
-
238
-
239
-
240
-
241
-
242
-
243
-
244
-
245
-
246
-
247
-
248
-
249
-
250
-
251
-
252
-
253
-
254
-
255
-
256
-
257
-
258
-
259
-
260
-
261
-
262
-
263
-
264
-
265
-
266
-
267
-
268
-
269
-
270
-
271
-
272
-
273
-
274
-
275
-
276
-
277
-
278
-
279
-
280
-
281
-
282
-
283
-
284
-
285
-
286
-
287
-
288
-
289
-
290
-
291
-
292
-
293
-
294
-
295
-
296
-
297
-
298
-
299
-
300
-
301
-
302
-
303
-
304
-
305
-
306
-
307
-
308
-
309
-
310
-
311
-
312
-
313
-
314
-
315
-
316
-
317
-
318
-
319
-
320
-
321
-
322
-
323
-
324
-
325
-
326
-
327
-
328
-
329
-
330
-
331
-
332
-
333
-
334
-
335
-
336
-
337
-
338
-
339
-
340
-
341
-
342
-
343
-
344
-
345
-
346
-
347
-
348
-
349
-
350
-
351
-
352
-
353
-
354
-
355
-
356
-
357
-
358
-
359
-
360
-
361
-
362
-
363
-
364
-
365
-
366
-
367
-
368
-
369
-
370
-
371
-
372
-
373
-
374
-
375
-
376
-
377
-
378
-
379
-
380
-
381
-
382
-
383
-
384
-
385
-
386
-
387
-
388
-
389
-
390
-
391
-
392
-
393
-
394
-
395
-
396
-
397
-
398
-
399
-
400
-
401
-
402
-
403
-
404
-
405
-
406
-
407
-
408
-
409
-
410
-
411
-
412
-
413
-
414
-
415
-
416
-
417
-
418
-
419
-
420
-
421
-
422
-
423
-
424
-
425
-
426
-
427
-
428
-
429
-
430
-
431
-
432
-
433
-
434
-
435
-
436
-
437
-
438
-
439
-
440
-
441
-
442
-
443
-
444
-
445
 |
 |
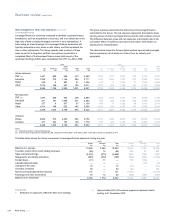
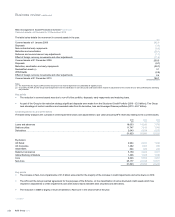
Risk management: Other risk exposures continued
Leveraged finance
Leveraged finance is commonly employed to facilitate corporate finance
transactions, such as acquisitions or buy-outs, and is so called due to the
high ratio of debt to equity (leverage) common in such transactions. A
bank acting as a lead manager for a leveraged finance transaction will
typically underwrite a loan, alone or with others, and then syndicate the
loan to other participants. The Group typically held a portion of these
loans as part of its long-term portfolio once primary syndication is
completed. Most of the leveraged finance loans held as part of the
syndicated lending portfolio were reclassified from HFT to LAR in 2008.
The gross exposure represents the total amount of leveraged finance
committed by the Group. The net exposure represents the balance sheet
carrying values of drawn leveraged finance and the total undrawn amount.
The difference between gross and net exposures is principally due to the
cumulative effect of impairment provisions and historic write-downs on
assets prior to reclassification.
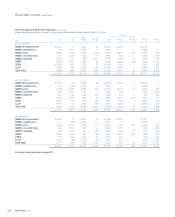
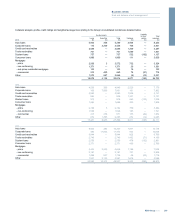
The table below shows the Groups global markets sponsor-led leveraged
finance exposures, all of which are in Non-Core, by industry and
geography.
2010 2009
UK
£m
Americas
£m
Othe
r
Europe
£m
RoW
£m
Total
£m
UK
£m
Americas
£m
Other
Europe
£m
RoW
£m
Total
£m
2008
Total
£m
Gross exposure:
TMT (1) 1,451 689 686 473 3,299
1,656 1,781 1,081 605 5,123 6,527
Industrial 1,009 273 1,144 285 2,711
1,523 1,584 1,781 207 5,095 5,410
Retail 290 8 867 61 1,226
476 17 1,354 71 1,918 3,082
Other 1,074 188 627 182 2,071
1,527 244 1,168 191 3,130 3,286
3,824 1,158 3,324 1,001 9,307
5,182 3,626 5,384 1,074 15,266 18,305
Net exposure:
TMT (1) 1,267 656 633 338 2,894
1,532 1,502 1,045 590 4,669 6,148
Industrial 911 181 1,094 277 2,463
973 524 1,594 205 3,296 3,708
Retail 277 8 817 57 1,159
445 17 1,282 68 1,812 2,714
Other 1,014 188 622 182 2,006
1,461 244 1,147 191 3,043 3,199
3,469 1,033 3,166 854 8,522
4,411 2,287 5,068 1,054 12,820 15,769
Of which:
Drawn 2,952 673 2,433 694 6,752
3,737 1,944 3,909 950 10,540 12,619
Undrawn 517 360 733 160 1,770
674 343 1,159 104 2,280 3,150
3,469 1,033 3,166 854 8,522
4,411 2,287 5,068 1,054 12,820 15,769
Notes:
(1) Telecommunications, media and technology.
(2) All of the above exposures are classified as LAR, except £154 million (2009 - £143 million; 2008 - £102 million) which are classified as HFT.
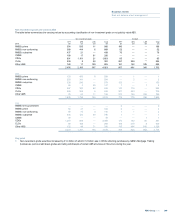
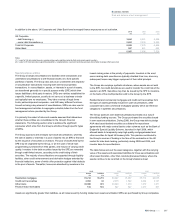
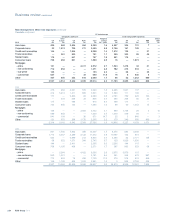
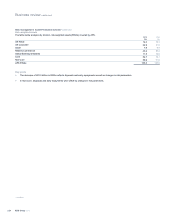
The table below shows the Group’s movement in leveraged finance exposures during the year.
2010 2009
Drawn
£m
Undrawn
£m
Total
£m Drawn
£m
Undrawn
£m
Total
£m
Balance at 1 January 10,540 2,280 12,820
12,619 3,150 15,769
Transfers (out)/in (from credit trading business) (38) 12 (26)
563 41 604
Sales and restructurings (3,575) (273) (3,848) (247) (144) (391)
Repayments and facility reductions (488) (272) (760) (934) (392) (1,326)
Funded deals (11) 11 —
166 (166) —
Lapsed/collapsed deals — — — — (19) (19)
Changes in fair value 73 — 73
(31) — (31)
Accretion of interest 50 — 50
100 — 100
Net recoveries/(impairment provisions) 131 — 131
(1,041) — (1,041)
Exchange and other movements 70 12 82
(655) (190) (845)
Balance at 31 December 6,752 1,770 8,522
10,540 2,280 12,820
Key points
xReduction in exposures reflect the Non-Core strategy.
xApproximately 92% of the above exposures represent senior
lending at 31 December 2010.
RBS Group 2010216
Business review continued