RBS 2010 Annual Report Download - page 378
Download and view the complete annual report
Please find page 378 of the 2010 RBS annual report below. You can navigate through the pages in the report by either clicking on the pages listed below, or by using the keyword search tool below to find specific information within the annual report.-
 1
1 -
2
-
3
-
4
-
5
-
6
-
7
-
8
-
9
-
10
-
11
-
12
-
13
-
14
-
15
-
16
-
17
-
18
-
19
-
20
-
21
-
22
-
23
-
24
-
25
-
26
-
27
-
28
-
29
-
30
-
31
-
32
-
33
-
34
-
35
-
36
-
37
-
38
-
39
-
40
-
41
-
42
-
43
-
44
-
45
-
46
-
47
-
48
-
49
-
50
-
51
-
52
-
53
-
54
-
55
-
56
-
57
-
58
-
59
-
60
-
61
-
62
-
63
-
64
-
65
-
66
-
67
-
68
-
69
-
70
-
71
-
72
-
73
-
74
-
75
-
76
-
77
-
78
-
79
-
80
-
81
-
82
-
83
-
84
-
85
-
86
-
87
-
88
-
89
-
90
-
91
-
92
-
93
-
94
-
95
-
96
-
97
-
98
-
99
-
100
-
101
-
102
-
103
-
104
-
105
-
106
-
107
-
108
-
109
-
110
-
111
-
112
-
113
-
114
-
115
-
116
-
117
-
118
-
119
-
120
-
121
-
122
-
123
-
124
-
125
-
126
-
127
-
128
-
129
-
130
-
131
-
132
-
133
-
134
-
135
-
136
-
137
-
138
-
139
-
140
-
141
-
142
-
143
-
144
-
145
-
146
-
147
-
148
-
149
-
150
-
151
-
152
-
153
-
154
-
155
-
156
-
157
-
158
-
159
-
160
-
161
-
162
-
163
-
164
-
165
-
166
-
167
-
168
-
169
-
170
-
171
-
172
-
173
-
174
-
175
-
176
-
177
-
178
-
179
-
180
-
181
-
182
-
183
-
184
-
185
-
186
-
187
-
188
-
189
-
190
-
191
-
192
-
193
-
194
-
195
-
196
-
197
-
198
-
199
-
200
-
201
-
202
-
203
-
204
-
205
-
206
-
207
-
208
-
209
-
210
-
211
-
212
-
213
-
214
-
215
-
216
-
217
-
218
-
219
-
220
-
221
-
222
-
223
-
224
-
225
-
226
-
227
-
228
-
229
-
230
-
231
-
232
-
233
-
234
-
235
-
236
-
237
-
238
-
239
-
240
-
241
-
242
-
243
-
244
-
245
-
246
-
247
-
248
-
249
-
250
-
251
-
252
-
253
-
254
-
255
-
256
-
257
-
258
-
259
-
260
-
261
-
262
-
263
-
264
-
265
-
266
-
267
-
268
-
269
-
270
-
271
-
272
-
273
-
274
-
275
-
276
-
277
-
278
-
279
-
280
-
281
-
282
-
283
-
284
-
285
-
286
-
287
-
288
-
289
-
290
-
291
-
292
-
293
-
294
-
295
-
296
-
297
-
298
-
299
-
300
-
301
-
302
-
303
-
304
-
305
-
306
-
307
-
308
-
309
-
310
-
311
-
312
-
313
-
314
-
315
-
316
-
317
-
318
-
319
-
320
-
321
-
322
-
323
-
324
-
325
-
326
-
327
-
328
-
329
-
330
-
331
-
332
-
333
-
334
-
335
-
336
-
337
-
338
-
339
-
340
-
341
-
342
-
343
-
344
-
345
-
346
-
347
-
348
-
349
-
350
-
351
-
352
-
353
-
354
-
355
-
356
-
357
-
358
-
359
-
360
-
361
-
362
-
363
-
364
-
365
-
366
-
367
-
 368
368 -
 369
369 -
 370
370 -
 371
371 -
 372
372 -
 373
373 -
 374
374 -
 375
375 -
 376
376 -
 377
377 -
 378
378 -
 379
379 -
 380
380 -
 381
381 -
 382
382 -
 383
383 -
 384
384 -
 385
385 -
 386
386 -
 387
387 -
 388
388 -
389
-
390
-
391
-
392
-
393
-
394
-
395
-
396
-
397
-
398
-
399
-
400
-
401
-
402
-
403
-
404
-
405
-
406
-
407
-
408
-
409
-
410
-
411
-
412
-
413
-
414
-
415
-
416
-
417
-
418
-
419
-
420
-
421
-
422
-
423
-
424
-
425
-
426
-
427
-
428
-
429
-
430
-
431
-
432
-
433
-
434
-
435
-
436
-
437
-
438
-
439
-
440
-
441
-
442
-
443
-
444
-
445
 |
 |

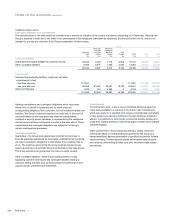
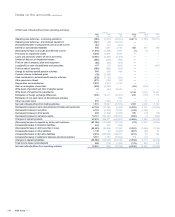
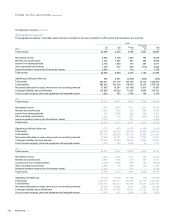
38 Analysis of changes in financing during the year
Group Company
Share capital,
share premium, paid-in equity
and merger reserve Subordinated liabilities
Share capital,
share premium, paid-in equity
and merger reserve Subordinated liabilities
2010
£m
2009
£m
2008
£m
2010
£m
2009
£m
2008
£m
2010
£m
2009
£m
2008
£m
2010
£m
2009
£m
2008
£m
At 1 January 64,240 49,323 31,806 37,652 49,154 38,043 53,359 38,442 20,925
8,762 10,314 7,743
Issue of ordinary shares 1— 49 ——— 1— 49 —— —
Redemption of
preference shares 117 (5,000) — ——— 117 (5,000) — —— —
Placing and open offers —5,274 19,741 ——— —5,274 19,741 —— —
Rights issue —— 12,000 ——— —— 12,000 —— —
Issue of B shares —25,101 — ——— —12,801 — —— —
Redemption of paid-in
equity (132) (308) — ——— (132) (308) — —— —
Cancellation of non-
voting deferred shares (27) — — ——— (27) — — —— —
Issue of subordinated
liabilities —— — —2,309 2,413 —— — —— —
Repayment of
subordinated liabilities —— — (1,588) (5,145) (1,727) —— — (98) (458) —
Net cash (outflow)/inflow
from financing (41) 25,067 31,790 (1,588) (2,836) 686 (41) 12,767 31,790 (98) (458) —
Investment in
subsidiaries —— — ——— — 12,300 — —— —
Transfer to retained
earnings (12,252) (10,150) (14,273) ——— (12,252) (10,150) (14,273) —— —
Other adjustments
including foreign
exchange (1) 803 — — (9,011) (8,666) 10,425 803 — — (616) (1,094) 2,571
At 31 December 52,750 64,240 49,323 27,053 37,652 49,154 41,869 53,359 38,442 8,048 8,762 10,314
Note:
(1) The Group subordinated liabilities amount for 2010 includes £6.1 billion relating to the disposal of RFS Holdings minority interest.
39 Analysis of cash and cash equivalents
Group Company
2010
£m
2009
£m
2008
£m
2010
£m
2009
£m
2008
£m
At 1 January
-cash 95,330 72,425 52,796 —— 5
-cash equivalents 48,856 62,500 96,159 16,448 5,069 1,568
144,186 134,925 148,955 16,448 5,069 1,573
Disposal of subsidiaries (4,112) — (3,171) —— —
Net cash inflow/(outflow) 12,456 9,261 (10,859) (14,091) 11,379 3,496
At 31 December 152,530 144,186 134,925 2,357 16,448 5,069
Comprising:
Cash and balances at central banks 56,590 51,811 12,007 —— —
Treasury bills and debt securities 5,672 15,818 15,623 —— —
Loans and advances to banks 90,268 76,557 107,295 2,357 16,448 5,069
Cash and cash equivalents 152,530 144,186 134,925 2,357 16,448 5,069
Certain subsidiary undertakings are required to maintain balances with the Bank of England which, at 31 December 2010, amounted to £424 million
(2009 - £450 million; 2008 - £393 million). Certain subsidiary undertakings are required by law to maintain reserve balances with the Federal Reserve
Bank in the US. Such reserve balances were nil at 31 December 2010, 2009 and 2008. RBS NV had mandatory reserve deposits of €1 million at 31
December 2010 (2009 - €6 million; 2008 - €3 million).
RBS Group 2010376
Notes on the accounts continued