RBS 2010 Annual Report Download - page 296
Download and view the complete annual report
Please find page 296 of the 2010 RBS annual report below. You can navigate through the pages in the report by either clicking on the pages listed below, or by using the keyword search tool below to find specific information within the annual report.-
 1
1 -
2
-
3
-
4
-
5
-
6
-
7
-
8
-
9
-
10
-
11
-
12
-
13
-
14
-
15
-
16
-
17
-
18
-
19
-
20
-
21
-
22
-
23
-
24
-
25
-
26
-
27
-
28
-
29
-
30
-
31
-
32
-
33
-
34
-
35
-
36
-
37
-
38
-
39
-
40
-
41
-
42
-
43
-
44
-
45
-
46
-
47
-
48
-
49
-
50
-
51
-
52
-
53
-
54
-
55
-
56
-
57
-
58
-
59
-
60
-
61
-
62
-
63
-
64
-
65
-
66
-
67
-
68
-
69
-
70
-
71
-
72
-
73
-
74
-
75
-
76
-
77
-
78
-
79
-
80
-
81
-
82
-
83
-
84
-
85
-
86
-
87
-
88
-
89
-
90
-
91
-
92
-
93
-
94
-
95
-
96
-
97
-
98
-
99
-
100
-
101
-
102
-
103
-
104
-
105
-
106
-
107
-
108
-
109
-
110
-
111
-
112
-
113
-
114
-
115
-
116
-
117
-
118
-
119
-
120
-
121
-
122
-
123
-
124
-
125
-
126
-
127
-
128
-
129
-
130
-
131
-
132
-
133
-
134
-
135
-
136
-
137
-
138
-
139
-
140
-
141
-
142
-
143
-
144
-
145
-
146
-
147
-
148
-
149
-
150
-
151
-
152
-
153
-
154
-
155
-
156
-
157
-
158
-
159
-
160
-
161
-
162
-
163
-
164
-
165
-
166
-
167
-
168
-
169
-
170
-
171
-
172
-
173
-
174
-
175
-
176
-
177
-
178
-
179
-
180
-
181
-
182
-
183
-
184
-
185
-
186
-
187
-
188
-
189
-
190
-
191
-
192
-
193
-
194
-
195
-
196
-
197
-
198
-
199
-
200
-
201
-
202
-
203
-
204
-
205
-
206
-
207
-
208
-
209
-
210
-
211
-
212
-
213
-
214
-
215
-
216
-
217
-
218
-
219
-
220
-
221
-
222
-
223
-
224
-
225
-
226
-
227
-
228
-
229
-
230
-
231
-
232
-
233
-
234
-
235
-
236
-
237
-
238
-
239
-
240
-
241
-
242
-
243
-
244
-
245
-
246
-
247
-
248
-
249
-
250
-
251
-
252
-
253
-
254
-
255
-
256
-
257
-
258
-
259
-
260
-
261
-
262
-
263
-
264
-
265
-
266
-
267
-
268
-
269
-
270
-
271
-
272
-
273
-
274
-
275
-
276
-
277
-
278
-
279
-
280
-
281
-
282
-
283
-
284
-
285
-
 286
286 -
 287
287 -
 288
288 -
 289
289 -
 290
290 -
 291
291 -
 292
292 -
 293
293 -
 294
294 -
 295
295 -
 296
296 -
 297
297 -
 298
298 -
 299
299 -
 300
300 -
 301
301 -
 302
302 -
 303
303 -
 304
304 -
 305
305 -
 306
306 -
307
-
308
-
309
-
310
-
311
-
312
-
313
-
314
-
315
-
316
-
317
-
318
-
319
-
320
-
321
-
322
-
323
-
324
-
325
-
326
-
327
-
328
-
329
-
330
-
331
-
332
-
333
-
334
-
335
-
336
-
337
-
338
-
339
-
340
-
341
-
342
-
343
-
344
-
345
-
346
-
347
-
348
-
349
-
350
-
351
-
352
-
353
-
354
-
355
-
356
-
357
-
358
-
359
-
360
-
361
-
362
-
363
-
364
-
365
-
366
-
367
-
368
-
369
-
370
-
371
-
372
-
373
-
374
-
375
-
376
-
377
-
378
-
379
-
380
-
381
-
382
-
383
-
384
-
385
-
386
-
387
-
388
-
389
-
390
-
391
-
392
-
393
-
394
-
395
-
396
-
397
-
398
-
399
-
400
-
401
-
402
-
403
-
404
-
405
-
406
-
407
-
408
-
409
-
410
-
411
-
412
-
413
-
414
-
415
-
416
-
417
-
418
-
419
-
420
-
421
-
422
-
423
-
424
-
425
-
426
-
427
-
428
-
429
-
430
-
431
-
432
-
433
-
434
-
435
-
436
-
437
-
438
-
439
-
440
-
441
-
442
-
443
-
444
-
445
 |
 |

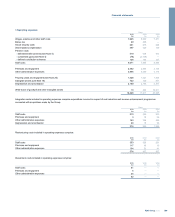
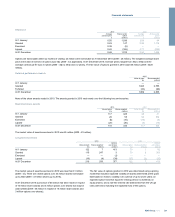
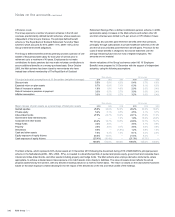
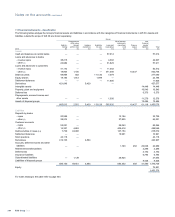
4 Pension costs continued
Main scheme All schemes
Changes in value of net pension deficit/(surplus)
Fair value
of plan
assets
£m
Present
value of
defined
benefit
obligations
£m
Net
pension
deficit/
(surplus)
£m
Fair value
of plan
assets
£m
Present
value of
defined
benefit
obligations
£m
Net
pension
deficit/
(surplus)
£m
At 1 January 2009 14,804 15,594 790 25,756 27,752 1,996
Currency translation and other adjustments — — — (699) (813) (114)
Income statement
Expected return 1,029 (1,029) 1,553 (1,553)
Interest cost 999 999 1,614 1,614
Current service cost 300 300 583 583
Past service cost 15 15 15 15
Gains on curtailments (1,947) (1,947) (2,148) (2,148)
1,029 (633) (1,662) 1,553 64 (1,489)
Statement of comprehensive income
-Actuarial gains and losses 993 4,473 3,480 1,344 5,009 3,665
Contributions by employer 536 — (536) 1,153 — (1,153)
Contributions by plan participants and other scheme members 2 2 — 15 15 —
Benefits paid (741) (741) — (1,175) (1,175) —
Expenses included in service cost (20) (20) — (22) (22) —
At 1 January 2010 16,603 18,675 2,072 27,925 30,830 2,905
Currency translation and other adjustments — — — (206) (206) —
Income statement
Expected return 1,114 (1,114) 1,428 (1,428)
Interest cost 1,091 1,091 1,402 1,402
Current service cost 345 345 499 499
Past service cost 76 76 67 67
Gains on curtailments — — (78) (78)
1,114 1,512 398 1,428 1,890 462
Statement of comprehensive income
-Actuarial gains and losses 1,718 1,674 (44) 1,797 1,639 (158)
Disposal of subsidiaries — — — (7,993) (8,187) (194)
Contributions by employer 444 — (444) 832 — (832)
Contributions by plan participants and other scheme members — — — 10 10 —
Benefits paid (716) (716) — (922) (922) —
Expenses included in service cost (53) (53) — (55) (55) —
At 31 December 2010 19,110 21,092 1,982 22,816 24,999 2,183
Net pension deficit/(surplus) comprises 2010
£m
2009
£m
2008
£m
Net assets of schemes in surplus (included in Prepayments, accrued income and other assets, Note 21) (105) (58) (36)
Net liabilities of schemes in deficit 2,288 2,963 2,032
2,183 2,905 1,996
RBS Group 2010294
Notes on the accounts continued