RBS 2010 Annual Report Download - page 315
Download and view the complete annual report
Please find page 315 of the 2010 RBS annual report below. You can navigate through the pages in the report by either clicking on the pages listed below, or by using the keyword search tool below to find specific information within the annual report.-
 1
1 -
2
-
3
-
4
-
5
-
6
-
7
-
8
-
9
-
10
-
11
-
12
-
13
-
14
-
15
-
16
-
17
-
18
-
19
-
20
-
21
-
22
-
23
-
24
-
25
-
26
-
27
-
28
-
29
-
30
-
31
-
32
-
33
-
34
-
35
-
36
-
37
-
38
-
39
-
40
-
41
-
42
-
43
-
44
-
45
-
46
-
47
-
48
-
49
-
50
-
51
-
52
-
53
-
54
-
55
-
56
-
57
-
58
-
59
-
60
-
61
-
62
-
63
-
64
-
65
-
66
-
67
-
68
-
69
-
70
-
71
-
72
-
73
-
74
-
75
-
76
-
77
-
78
-
79
-
80
-
81
-
82
-
83
-
84
-
85
-
86
-
87
-
88
-
89
-
90
-
91
-
92
-
93
-
94
-
95
-
96
-
97
-
98
-
99
-
100
-
101
-
102
-
103
-
104
-
105
-
106
-
107
-
108
-
109
-
110
-
111
-
112
-
113
-
114
-
115
-
116
-
117
-
118
-
119
-
120
-
121
-
122
-
123
-
124
-
125
-
126
-
127
-
128
-
129
-
130
-
131
-
132
-
133
-
134
-
135
-
136
-
137
-
138
-
139
-
140
-
141
-
142
-
143
-
144
-
145
-
146
-
147
-
148
-
149
-
150
-
151
-
152
-
153
-
154
-
155
-
156
-
157
-
158
-
159
-
160
-
161
-
162
-
163
-
164
-
165
-
166
-
167
-
168
-
169
-
170
-
171
-
172
-
173
-
174
-
175
-
176
-
177
-
178
-
179
-
180
-
181
-
182
-
183
-
184
-
185
-
186
-
187
-
188
-
189
-
190
-
191
-
192
-
193
-
194
-
195
-
196
-
197
-
198
-
199
-
200
-
201
-
202
-
203
-
204
-
205
-
206
-
207
-
208
-
209
-
210
-
211
-
212
-
213
-
214
-
215
-
216
-
217
-
218
-
219
-
220
-
221
-
222
-
223
-
224
-
225
-
226
-
227
-
228
-
229
-
230
-
231
-
232
-
233
-
234
-
235
-
236
-
237
-
238
-
239
-
240
-
241
-
242
-
243
-
244
-
245
-
246
-
247
-
248
-
249
-
250
-
251
-
252
-
253
-
254
-
255
-
256
-
257
-
258
-
259
-
260
-
261
-
262
-
263
-
264
-
265
-
266
-
267
-
268
-
269
-
270
-
271
-
272
-
273
-
274
-
275
-
276
-
277
-
278
-
279
-
280
-
281
-
282
-
283
-
284
-
285
-
286
-
287
-
288
-
289
-
290
-
291
-
292
-
293
-
294
-
295
-
296
-
297
-
298
-
299
-
300
-
301
-
302
-
303
-
304
-
 305
305 -
 306
306 -
 307
307 -
 308
308 -
 309
309 -
 310
310 -
 311
311 -
 312
312 -
 313
313 -
 314
314 -
 315
315 -
 316
316 -
 317
317 -
 318
318 -
 319
319 -
 320
320 -
 321
321 -
 322
322 -
 323
323 -
 324
324 -
 325
325 -
326
-
327
-
328
-
329
-
330
-
331
-
332
-
333
-
334
-
335
-
336
-
337
-
338
-
339
-
340
-
341
-
342
-
343
-
344
-
345
-
346
-
347
-
348
-
349
-
350
-
351
-
352
-
353
-
354
-
355
-
356
-
357
-
358
-
359
-
360
-
361
-
362
-
363
-
364
-
365
-
366
-
367
-
368
-
369
-
370
-
371
-
372
-
373
-
374
-
375
-
376
-
377
-
378
-
379
-
380
-
381
-
382
-
383
-
384
-
385
-
386
-
387
-
388
-
389
-
390
-
391
-
392
-
393
-
394
-
395
-
396
-
397
-
398
-
399
-
400
-
401
-
402
-
403
-
404
-
405
-
406
-
407
-
408
-
409
-
410
-
411
-
412
-
413
-
414
-
415
-
416
-
417
-
418
-
419
-
420
-
421
-
422
-
423
-
424
-
425
-
426
-
427
-
428
-
429
-
430
-
431
-
432
-
433
-
434
-
435
-
436
-
437
-
438
-
439
-
440
-
441
-
442
-
443
-
444
-
445
 |
 |

Own credit
The Group takes into account the effect of its own credit standing when
valuing financial liabilities recorded at fair value in accordance with IFRS.
The categories of financial liabilities on which own credit spread
adjustments are made are issued debt held at fair value, including issued
structured notes and derivatives. An own credit adjustment is applied to
positions where it is believed that counterparties would consider the
Group's creditworthiness when pricing trades.
For issued debt and structured notes, this adjustment is based on
independent quotes from market participants for the debt issuance
spreads above average inter-bank rates, (at a range of tenors) which the
market would demand when purchasing new senior or sub-debt
issuances from the Group. Where necessary, these quotes are
interpolated using a curve shape derived from credit default swap prices.
The fair value of the Group's derivative financial liabilities has also been
adjusted to reflect the Group's own credit risk. The adjustment takes into
account collateral posted by the Group and the effects of master netting
agreements.
The own credit adjustment for fair value does not alter cash flows, is not
used for performance management and is disregarded for regulatory
capital reporting processes and will reverse over time as the liabilities
mature.
The reserve movement between periods will not equate to the reported
profit or loss for own credit. The balance sheet reserves are stated by
conversion of underlying currency balances at spot rates for each period
whereas the income statement includes intra-period foreign exchange
sell-offs.
The effect of change in credit spreads could be reversed in future periods,
provided the liability is not repaid at a premium or a discount.
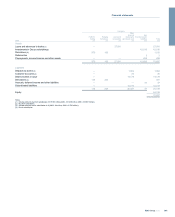
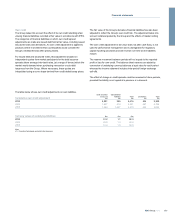
The table below shows own credit adjustments on own liabilities.
Cumulative own credit adjustment
Debt securities
in issue (1)
£m
Subordinated
liabilities
£m
Total
£m
Derivatives
£m
Total
£m
2010 2,091 325 2,416 534 2,950
2009 1,857 474 2,331 467 2,798
2008 1,346 1,027 2,373 450 2,823
Carrying values of underlying liabilities £bn £bn £bn
2010 51.2 1.1 52.3
2009 45.5 1.3 46.8
2008 51.4 1.5 52.9
Note:
(1) Consists of wholesale and retail note issuances.
313RBS Group 2010
Financial statements