RBS 2010 Annual Report Download - page 85
Download and view the complete annual report
Please find page 85 of the 2010 RBS annual report below. You can navigate through the pages in the report by either clicking on the pages listed below, or by using the keyword search tool below to find specific information within the annual report.-
 1
1 -
2
-
3
-
4
-
5
-
6
-
7
-
8
-
9
-
10
-
11
-
12
-
13
-
14
-
15
-
16
-
17
-
18
-
19
-
20
-
21
-
22
-
23
-
24
-
25
-
26
-
27
-
28
-
29
-
30
-
31
-
32
-
33
-
34
-
35
-
36
-
37
-
38
-
39
-
40
-
41
-
42
-
43
-
44
-
45
-
46
-
47
-
48
-
49
-
50
-
51
-
52
-
53
-
54
-
55
-
56
-
57
-
58
-
59
-
60
-
61
-
62
-
63
-
64
-
65
-
66
-
67
-
68
-
69
-
70
-
71
-
72
-
73
-
74
-
 75
75 -
 76
76 -
 77
77 -
 78
78 -
 79
79 -
 80
80 -
 81
81 -
 82
82 -
 83
83 -
 84
84 -
 85
85 -
 86
86 -
 87
87 -
 88
88 -
 89
89 -
 90
90 -
 91
91 -
 92
92 -
 93
93 -
 94
94 -
 95
95 -
96
-
97
-
98
-
99
-
100
-
101
-
102
-
103
-
104
-
105
-
106
-
107
-
108
-
109
-
110
-
111
-
112
-
113
-
114
-
115
-
116
-
117
-
118
-
119
-
120
-
121
-
122
-
123
-
124
-
125
-
126
-
127
-
128
-
129
-
130
-
131
-
132
-
133
-
134
-
135
-
136
-
137
-
138
-
139
-
140
-
141
-
142
-
143
-
144
-
145
-
146
-
147
-
148
-
149
-
150
-
151
-
152
-
153
-
154
-
155
-
156
-
157
-
158
-
159
-
160
-
161
-
162
-
163
-
164
-
165
-
166
-
167
-
168
-
169
-
170
-
171
-
172
-
173
-
174
-
175
-
176
-
177
-
178
-
179
-
180
-
181
-
182
-
183
-
184
-
185
-
186
-
187
-
188
-
189
-
190
-
191
-
192
-
193
-
194
-
195
-
196
-
197
-
198
-
199
-
200
-
201
-
202
-
203
-
204
-
205
-
206
-
207
-
208
-
209
-
210
-
211
-
212
-
213
-
214
-
215
-
216
-
217
-
218
-
219
-
220
-
221
-
222
-
223
-
224
-
225
-
226
-
227
-
228
-
229
-
230
-
231
-
232
-
233
-
234
-
235
-
236
-
237
-
238
-
239
-
240
-
241
-
242
-
243
-
244
-
245
-
246
-
247
-
248
-
249
-
250
-
251
-
252
-
253
-
254
-
255
-
256
-
257
-
258
-
259
-
260
-
261
-
262
-
263
-
264
-
265
-
266
-
267
-
268
-
269
-
270
-
271
-
272
-
273
-
274
-
275
-
276
-
277
-
278
-
279
-
280
-
281
-
282
-
283
-
284
-
285
-
286
-
287
-
288
-
289
-
290
-
291
-
292
-
293
-
294
-
295
-
296
-
297
-
298
-
299
-
300
-
301
-
302
-
303
-
304
-
305
-
306
-
307
-
308
-
309
-
310
-
311
-
312
-
313
-
314
-
315
-
316
-
317
-
318
-
319
-
320
-
321
-
322
-
323
-
324
-
325
-
326
-
327
-
328
-
329
-
330
-
331
-
332
-
333
-
334
-
335
-
336
-
337
-
338
-
339
-
340
-
341
-
342
-
343
-
344
-
345
-
346
-
347
-
348
-
349
-
350
-
351
-
352
-
353
-
354
-
355
-
356
-
357
-
358
-
359
-
360
-
361
-
362
-
363
-
364
-
365
-
366
-
367
-
368
-
369
-
370
-
371
-
372
-
373
-
374
-
375
-
376
-
377
-
378
-
379
-
380
-
381
-
382
-
383
-
384
-
385
-
386
-
387
-
388
-
389
-
390
-
391
-
392
-
393
-
394
-
395
-
396
-
397
-
398
-
399
-
400
-
401
-
402
-
403
-
404
-
405
-
406
-
407
-
408
-
409
-
410
-
411
-
412
-
413
-
414
-
415
-
416
-
417
-
418
-
419
-
420
-
421
-
422
-
423
-
424
-
425
-
426
-
427
-
428
-
429
-
430
-
431
-
432
-
433
-
434
-
435
-
436
-
437
-
438
-
439
-
440
-
441
-
442
-
443
-
444
-
445
 |
 |

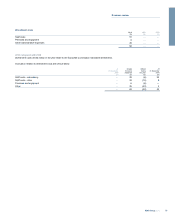
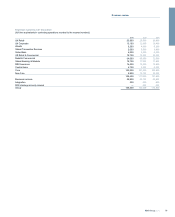
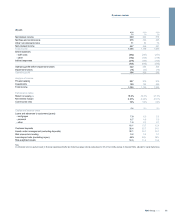
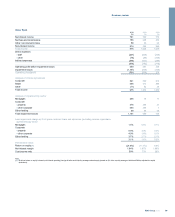
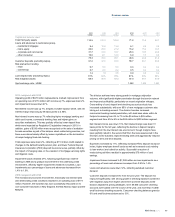
UK Corporate
2010 2009 2008
£m £m £m
Net interest income 2,572 2,292 2,448
Net fees and commissions 952 858 829
Other non-interest income 371 432 460
Non-interest income 1,323 1,290 1,289
Total income 3,895 3,582 3,737
Direct expenses
- staff (778) (753) (801)
- other (359) (260) (318)
Indirect expenses (534) (517) (518)
(1,671) (1,530) (1,637)
Operating profit before impairment losses 2,224 2,052 2,100
Impairment losses (761) (927) (319)
Operating profit 1,463 1,125 1,781
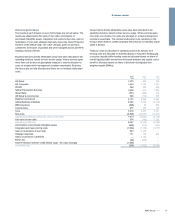
Analysis of income by business
Corporate and commercial lending 2,598 2,131 2,094
Asset and invoice finance 617 501 312
Corporate deposits 728 986 1,266
Other (48) (36) 65
Total income 3,895 3,582 3,737
Analysis of impairment by sector
Banks and financial institutions 20 15 9
Hotels and restaurants 52 98 25
House building and construction 131 106 42
Manufacturing 151 14
Other 127 150 53
Private sector education, health, social work, recreational and community services 30 59 15
Property 245 259 24
Wholesale and retail trade, repairs 91 76 37
Asset and invoice finance 64 113 100
Total impairment losses 761 927 319
Loan impairment charge as % of gross customer loans and advances (excluding reverse repurchase
agreements) by sector
Banks and financial institutions 0.3% 0.2% 0.2%
Hotels and restaurants 0.8% 1.5% 0.4%
House building and construction 2.9% 2.5% 0.8%
Manufacturing —0.9% 0.3%
Other 0.4% 0.5% 0.1%
Private sector education, health, social work, recreational and community services 0.3% 0.9% 0.2%
Property 0.8% 0.8% 0.1%
Wholesale and retail trade, repairs 0.9% 0.7% 0.4%
Asset and invoice finance 0.6% 1.3% 1.2%
0.7% 0.8% 0.3%
Performance ratios
Return on equity (1) 12.1% 9.4% 15.9%
Net interest margin 2.51% 2.22% 2.40%
Cost:income ratio 43% 43% 44%
Note:
(1) Divisional return on equity is based on divisional operating profit after tax divided by average notional equity (based on 9% of the monthly average of divisional RWAs, adjusted for capital deductions).
83RBS Group 2010
Business review