RBS 2010 Annual Report Download - page 254
Download and view the complete annual report
Please find page 254 of the 2010 RBS annual report below. You can navigate through the pages in the report by either clicking on the pages listed below, or by using the keyword search tool below to find specific information within the annual report.-
 1
1 -
2
-
3
-
4
-
5
-
6
-
7
-
8
-
9
-
10
-
11
-
12
-
13
-
14
-
15
-
16
-
17
-
18
-
19
-
20
-
21
-
22
-
23
-
24
-
25
-
26
-
27
-
28
-
29
-
30
-
31
-
32
-
33
-
34
-
35
-
36
-
37
-
38
-
39
-
40
-
41
-
42
-
43
-
44
-
45
-
46
-
47
-
48
-
49
-
50
-
51
-
52
-
53
-
54
-
55
-
56
-
57
-
58
-
59
-
60
-
61
-
62
-
63
-
64
-
65
-
66
-
67
-
68
-
69
-
70
-
71
-
72
-
73
-
74
-
75
-
76
-
77
-
78
-
79
-
80
-
81
-
82
-
83
-
84
-
85
-
86
-
87
-
88
-
89
-
90
-
91
-
92
-
93
-
94
-
95
-
96
-
97
-
98
-
99
-
100
-
101
-
102
-
103
-
104
-
105
-
106
-
107
-
108
-
109
-
110
-
111
-
112
-
113
-
114
-
115
-
116
-
117
-
118
-
119
-
120
-
121
-
122
-
123
-
124
-
125
-
126
-
127
-
128
-
129
-
130
-
131
-
132
-
133
-
134
-
135
-
136
-
137
-
138
-
139
-
140
-
141
-
142
-
143
-
144
-
145
-
146
-
147
-
148
-
149
-
150
-
151
-
152
-
153
-
154
-
155
-
156
-
157
-
158
-
159
-
160
-
161
-
162
-
163
-
164
-
165
-
166
-
167
-
168
-
169
-
170
-
171
-
172
-
173
-
174
-
175
-
176
-
177
-
178
-
179
-
180
-
181
-
182
-
183
-
184
-
185
-
186
-
187
-
188
-
189
-
190
-
191
-
192
-
193
-
194
-
195
-
196
-
197
-
198
-
199
-
200
-
201
-
202
-
203
-
204
-
205
-
206
-
207
-
208
-
209
-
210
-
211
-
212
-
213
-
214
-
215
-
216
-
217
-
218
-
219
-
220
-
221
-
222
-
223
-
224
-
225
-
226
-
227
-
228
-
229
-
230
-
231
-
232
-
233
-
234
-
235
-
236
-
237
-
238
-
239
-
240
-
241
-
242
-
243
-
 244
244 -
 245
245 -
 246
246 -
 247
247 -
 248
248 -
 249
249 -
 250
250 -
 251
251 -
 252
252 -
 253
253 -
 254
254 -
 255
255 -
 256
256 -
 257
257 -
 258
258 -
 259
259 -
 260
260 -
 261
261 -
 262
262 -
 263
263 -
 264
264 -
265
-
266
-
267
-
268
-
269
-
270
-
271
-
272
-
273
-
274
-
275
-
276
-
277
-
278
-
279
-
280
-
281
-
282
-
283
-
284
-
285
-
286
-
287
-
288
-
289
-
290
-
291
-
292
-
293
-
294
-
295
-
296
-
297
-
298
-
299
-
300
-
301
-
302
-
303
-
304
-
305
-
306
-
307
-
308
-
309
-
310
-
311
-
312
-
313
-
314
-
315
-
316
-
317
-
318
-
319
-
320
-
321
-
322
-
323
-
324
-
325
-
326
-
327
-
328
-
329
-
330
-
331
-
332
-
333
-
334
-
335
-
336
-
337
-
338
-
339
-
340
-
341
-
342
-
343
-
344
-
345
-
346
-
347
-
348
-
349
-
350
-
351
-
352
-
353
-
354
-
355
-
356
-
357
-
358
-
359
-
360
-
361
-
362
-
363
-
364
-
365
-
366
-
367
-
368
-
369
-
370
-
371
-
372
-
373
-
374
-
375
-
376
-
377
-
378
-
379
-
380
-
381
-
382
-
383
-
384
-
385
-
386
-
387
-
388
-
389
-
390
-
391
-
392
-
393
-
394
-
395
-
396
-
397
-
398
-
399
-
400
-
401
-
402
-
403
-
404
-
405
-
406
-
407
-
408
-
409
-
410
-
411
-
412
-
413
-
414
-
415
-
416
-
417
-
418
-
419
-
420
-
421
-
422
-
423
-
424
-
425
-
426
-
427
-
428
-
429
-
430
-
431
-
432
-
433
-
434
-
435
-
436
-
437
-
438
-
439
-
440
-
441
-
442
-
443
-
444
-
445
 |
 |

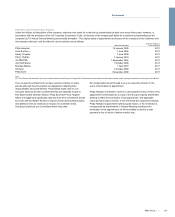
Relative TSR (applying to 25% of overall 2011 LTIP award in total)
Relative TSR has been retained in the LTIP to provide a direct
connection between the reward provided to executive directors and the
relative performance delivered to our shareholders.
The relative TSR performance condition is identical to that applying for
2010 LTIP awards. The relative TSR measure compares the Group’s
performance over a three year performance period against a basket of
banks from the UK and overseas, weighted towards those companies
most similar to the Group.
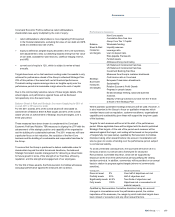
The companies in the comparator group for 2011 awards are as follows:
Comparator companies Weighting
1Barclays 200%
2Lloyds Banking Group
3 Santander 150%
4HSBC
5Standard Chartered
6Citigroup 100%
7Deutsche Bank
8JP Morgan Chase
9Bank of America 50%
10 BBVA
11 BNP Paribas
12 Credit Agricole
13 Credit Suisse Group
14 National Australia Bank Limited
15 Royal Bank of Canada
16 Societe Generale
17 The Toronto-Dominion Bank Group
18 UBS
19 Unicredito
20 Wells Fargo & Company
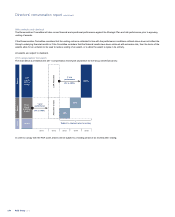
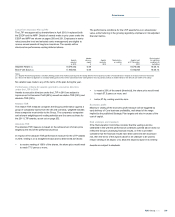
To receive any of the LTIP awards subject to this performance measure
the Group’s performance must be at least as good as the median of the
comparator companies, with vesting as follows:
x20% of the award will vest if the Group’s TSR is at the median of the
companies in the comparator group.
x100% of the award will vest if the Group’s TSR is at the upper
quartile of the companies in the comparator group.
Apro-rata proportion of the award will vest in between these points.
Core bank Economic Profit (applying to 25% of overall 2011 LTIP
award in total)
At the end of the performance period for these awards, the value of the
Group will be determined by the Core bank’s ability to generate enduring
returns for shareholders. For this reason for the 2011 LTIP awards the
Economic Profit measure is focused on the Core bank. The focus on
Core bank Economic Profit ensures that performance reflects enduring
earnings for the bank, while the Balance Sheet & Risk targets capture
performance of Non-Core.
Economic Profit, being a risk-adjusted financial measure, is consistent
with the FSA Code, and also provides a balance between measuring
growth and the cost of capital employed in delivering that growth.
RBS Group 2010252
Directors’ remuneration report continued