RBS 2010 Annual Report Download - page 257
Download and view the complete annual report
Please find page 257 of the 2010 RBS annual report below. You can navigate through the pages in the report by either clicking on the pages listed below, or by using the keyword search tool below to find specific information within the annual report.-
 1
1 -
2
-
3
-
4
-
5
-
6
-
7
-
8
-
9
-
10
-
11
-
12
-
13
-
14
-
15
-
16
-
17
-
18
-
19
-
20
-
21
-
22
-
23
-
24
-
25
-
26
-
27
-
28
-
29
-
30
-
31
-
32
-
33
-
34
-
35
-
36
-
37
-
38
-
39
-
40
-
41
-
42
-
43
-
44
-
45
-
46
-
47
-
48
-
49
-
50
-
51
-
52
-
53
-
54
-
55
-
56
-
57
-
58
-
59
-
60
-
61
-
62
-
63
-
64
-
65
-
66
-
67
-
68
-
69
-
70
-
71
-
72
-
73
-
74
-
75
-
76
-
77
-
78
-
79
-
80
-
81
-
82
-
83
-
84
-
85
-
86
-
87
-
88
-
89
-
90
-
91
-
92
-
93
-
94
-
95
-
96
-
97
-
98
-
99
-
100
-
101
-
102
-
103
-
104
-
105
-
106
-
107
-
108
-
109
-
110
-
111
-
112
-
113
-
114
-
115
-
116
-
117
-
118
-
119
-
120
-
121
-
122
-
123
-
124
-
125
-
126
-
127
-
128
-
129
-
130
-
131
-
132
-
133
-
134
-
135
-
136
-
137
-
138
-
139
-
140
-
141
-
142
-
143
-
144
-
145
-
146
-
147
-
148
-
149
-
150
-
151
-
152
-
153
-
154
-
155
-
156
-
157
-
158
-
159
-
160
-
161
-
162
-
163
-
164
-
165
-
166
-
167
-
168
-
169
-
170
-
171
-
172
-
173
-
174
-
175
-
176
-
177
-
178
-
179
-
180
-
181
-
182
-
183
-
184
-
185
-
186
-
187
-
188
-
189
-
190
-
191
-
192
-
193
-
194
-
195
-
196
-
197
-
198
-
199
-
200
-
201
-
202
-
203
-
204
-
205
-
206
-
207
-
208
-
209
-
210
-
211
-
212
-
213
-
214
-
215
-
216
-
217
-
218
-
219
-
220
-
221
-
222
-
223
-
224
-
225
-
226
-
227
-
228
-
229
-
230
-
231
-
232
-
233
-
234
-
235
-
236
-
237
-
238
-
239
-
240
-
241
-
242
-
243
-
244
-
245
-
246
-
 247
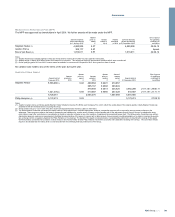
247 -
 248
248 -
 249
249 -
 250
250 -
 251
251 -
 252
252 -
 253
253 -
 254
254 -
 255
255 -
 256
256 -
 257
257 -
 258
258 -
 259
259 -
 260
260 -
 261
261 -
 262
262 -
 263
263 -
 264
264 -
 265
265 -
 266
266 -
 267
267 -
268
-
269
-
270
-
271
-
272
-
273
-
274
-
275
-
276
-
277
-
278
-
279
-
280
-
281
-
282
-
283
-
284
-
285
-
286
-
287
-
288
-
289
-
290
-
291
-
292
-
293
-
294
-
295
-
296
-
297
-
298
-
299
-
300
-
301
-
302
-
303
-
304
-
305
-
306
-
307
-
308
-
309
-
310
-
311
-
312
-
313
-
314
-
315
-
316
-
317
-
318
-
319
-
320
-
321
-
322
-
323
-
324
-
325
-
326
-
327
-
328
-
329
-
330
-
331
-
332
-
333
-
334
-
335
-
336
-
337
-
338
-
339
-
340
-
341
-
342
-
343
-
344
-
345
-
346
-
347
-
348
-
349
-
350
-
351
-
352
-
353
-
354
-
355
-
356
-
357
-
358
-
359
-
360
-
361
-
362
-
363
-
364
-
365
-
366
-
367
-
368
-
369
-
370
-
371
-
372
-
373
-
374
-
375
-
376
-
377
-
378
-
379
-
380
-
381
-
382
-
383
-
384
-
385
-
386
-
387
-
388
-
389
-
390
-
391
-
392
-
393
-
394
-
395
-
396
-
397
-
398
-
399
-
400
-
401
-
402
-
403
-
404
-
405
-
406
-
407
-
408
-
409
-
410
-
411
-
412
-
413
-
414
-
415
-
416
-
417
-
418
-
419
-
420
-
421
-
422
-
423
-
424
-
425
-
426
-
427
-
428
-
429
-
430
-
431
-
432
-
433
-
434
-
435
-
436
-
437
-
438
-
439
-
440
-
441
-
442
-
443
-
444
-
445
 |
 |
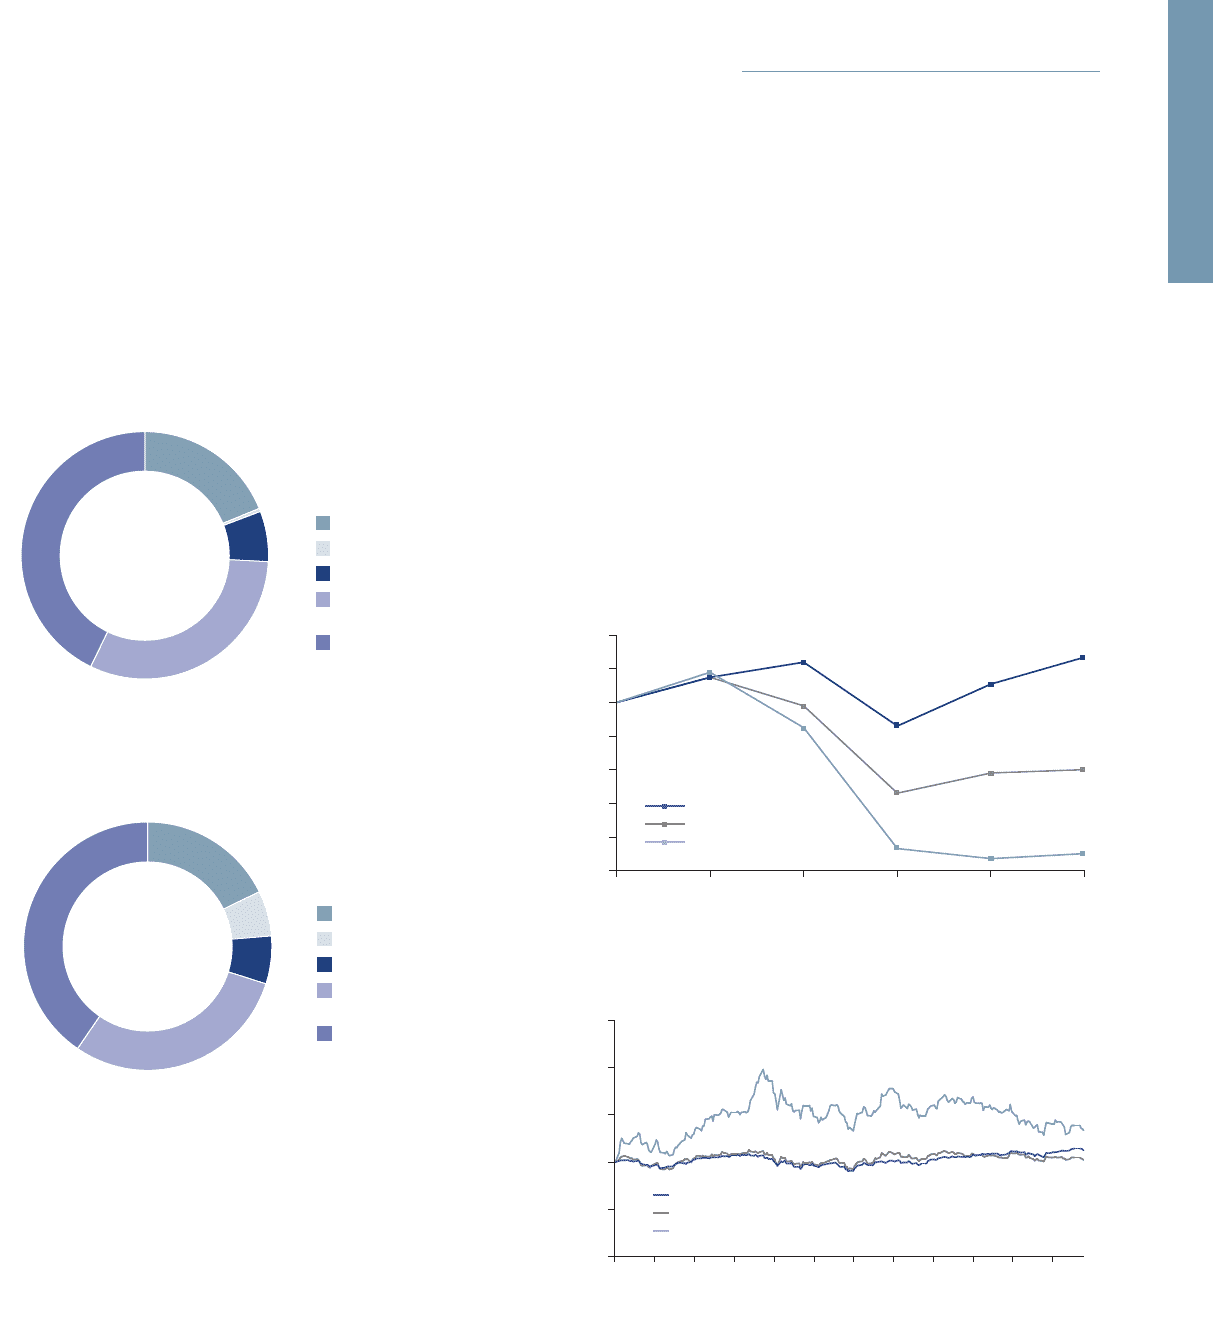
Shareholding guidelines
The Group operates shareholding guidelines for executive directors. The
target shareholding level is 200% of gross annual salary for the Group
Chief Executive and 100% of gross annual salary for executive directors.
Executive directors have a period of five years in which to build up their
shareholdings to meet the guideline levels.
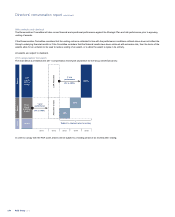
UK-based executive directors' remuneration balance
Executive director pay mix
Group Chief Executive - Stephen Hester
Group Finance Director - Bruce Van Saun
Non-executive directors
The level of remuneration for non-executive directors reflects their
responsibility and time commitment and the level of fees paid to non-
executive directors of comparable major UK companies. Non-executive
directors do not participate in any incentive or performance plan. Non-
executive director fees are reviewed regularly. Fees paid to non-
executive directors for the year ended 31 December 2010 are set out on
page 258.
Total shareholder return performance
The performance graph below illustrates the performance of the company
over the past five years in terms of total shareholder return compared
with that of the companies comprising the FTSE 100 Index. This Index
has been selected because it represents a cross-section of leading UK
companies. The total shareholder return for FTSE banks for the same
period has been added for comparison. The total shareholder return for
the company and the indices have been rebased to 100 for 2005. The
second graph below illustrates the same performance of the company
during 2010.
Salary
Benefits
Pension allowance
On-Target Bonus (deferred
into shares)
Long-term incentive award
(expected value)
Total shareholder return
0
20
40
60
80
100
120
140
2005 2006 2007 2008 2009 2010
Royal Bank of Scotland FTSE 100 FTSE Banks
Source : Thomson Reuters Datastream
Salary
Benefits
Total shareholder return - one year
255RBS Group 2010
Governance
Salary
Benefits
Pension allowance
On-Target Bonus
(deferred into shares)
Long term incentive award
(expected value)
Salary
Benefits
Pension allowance
On-Target Bonus
(deferred into shares)
Long term incentive award
(expected value)
The charts above show the composition of remuneration opportunity for
on-target annual performance, and with the long term incentive awards
shown at the expected value. Short term incentive payments earned in
relation to 2011 performance will be deferred and will vest, subject to
satisfactory performance. The actual value of the long term incentive
awards will depend on performance over the period 2011 to 2013 and the
share price at the time the awards vest.
FTSE 100
FTSE Banks
RBS
Jan Feb Mar Apr May Jun Jul Aug Sep Oct Nov Dec
50
100
150
200
250
0
FTSE 100
FTSE Banks
RBS
2005 2006 2007 2008 2009 2010
20
40
60
80
100
120
140
0