RBS 2010 Annual Report Download - page 140
Download and view the complete annual report
Please find page 140 of the 2010 RBS annual report below. You can navigate through the pages in the report by either clicking on the pages listed below, or by using the keyword search tool below to find specific information within the annual report.-
 1
1 -
2
-
3
-
4
-
5
-
6
-
7
-
8
-
9
-
10
-
11
-
12
-
13
-
14
-
15
-
16
-
17
-
18
-
19
-
20
-
21
-
22
-
23
-
24
-
25
-
26
-
27
-
28
-
29
-
30
-
31
-
32
-
33
-
34
-
35
-
36
-
37
-
38
-
39
-
40
-
41
-
42
-
43
-
44
-
45
-
46
-
47
-
48
-
49
-
50
-
51
-
52
-
53
-
54
-
55
-
56
-
57
-
58
-
59
-
60
-
61
-
62
-
63
-
64
-
65
-
66
-
67
-
68
-
69
-
70
-
71
-
72
-
73
-
74
-
75
-
76
-
77
-
78
-
79
-
80
-
81
-
82
-
83
-
84
-
85
-
86
-
87
-
88
-
89
-
90
-
91
-
92
-
93
-
94
-
95
-
96
-
97
-
98
-
99
-
100
-
101
-
102
-
103
-
104
-
105
-
106
-
107
-
108
-
109
-
110
-
111
-
112
-
113
-
114
-
115
-
116
-
117
-
118
-
119
-
120
-
121
-
122
-
123
-
124
-
125
-
126
-
127
-
128
-
129
-
 130
130 -
 131
131 -
 132
132 -
 133
133 -
 134
134 -
 135
135 -
 136
136 -
 137
137 -
 138
138 -
 139
139 -
 140
140 -
 141
141 -
 142
142 -
 143
143 -
 144
144 -
 145
145 -
 146
146 -
 147
147 -
 148
148 -
 149
149 -
 150
150 -
151
-
152
-
153
-
154
-
155
-
156
-
157
-
158
-
159
-
160
-
161
-
162
-
163
-
164
-
165
-
166
-
167
-
168
-
169
-
170
-
171
-
172
-
173
-
174
-
175
-
176
-
177
-
178
-
179
-
180
-
181
-
182
-
183
-
184
-
185
-
186
-
187
-
188
-
189
-
190
-
191
-
192
-
193
-
194
-
195
-
196
-
197
-
198
-
199
-
200
-
201
-
202
-
203
-
204
-
205
-
206
-
207
-
208
-
209
-
210
-
211
-
212
-
213
-
214
-
215
-
216
-
217
-
218
-
219
-
220
-
221
-
222
-
223
-
224
-
225
-
226
-
227
-
228
-
229
-
230
-
231
-
232
-
233
-
234
-
235
-
236
-
237
-
238
-
239
-
240
-
241
-
242
-
243
-
244
-
245
-
246
-
247
-
248
-
249
-
250
-
251
-
252
-
253
-
254
-
255
-
256
-
257
-
258
-
259
-
260
-
261
-
262
-
263
-
264
-
265
-
266
-
267
-
268
-
269
-
270
-
271
-
272
-
273
-
274
-
275
-
276
-
277
-
278
-
279
-
280
-
281
-
282
-
283
-
284
-
285
-
286
-
287
-
288
-
289
-
290
-
291
-
292
-
293
-
294
-
295
-
296
-
297
-
298
-
299
-
300
-
301
-
302
-
303
-
304
-
305
-
306
-
307
-
308
-
309
-
310
-
311
-
312
-
313
-
314
-
315
-
316
-
317
-
318
-
319
-
320
-
321
-
322
-
323
-
324
-
325
-
326
-
327
-
328
-
329
-
330
-
331
-
332
-
333
-
334
-
335
-
336
-
337
-
338
-
339
-
340
-
341
-
342
-
343
-
344
-
345
-
346
-
347
-
348
-
349
-
350
-
351
-
352
-
353
-
354
-
355
-
356
-
357
-
358
-
359
-
360
-
361
-
362
-
363
-
364
-
365
-
366
-
367
-
368
-
369
-
370
-
371
-
372
-
373
-
374
-
375
-
376
-
377
-
378
-
379
-
380
-
381
-
382
-
383
-
384
-
385
-
386
-
387
-
388
-
389
-
390
-
391
-
392
-
393
-
394
-
395
-
396
-
397
-
398
-
399
-
400
-
401
-
402
-
403
-
404
-
405
-
406
-
407
-
408
-
409
-
410
-
411
-
412
-
413
-
414
-
415
-
416
-
417
-
418
-
419
-
420
-
421
-
422
-
423
-
424
-
425
-
426
-
427
-
428
-
429
-
430
-
431
-
432
-
433
-
434
-
435
-
436
-
437
-
438
-
439
-
440
-
441
-
442
-
443
-
444
-
445
 |
 |

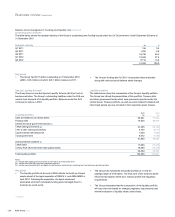
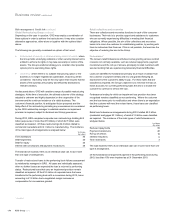
Balance sheet management: Funding and liquidity risk continued
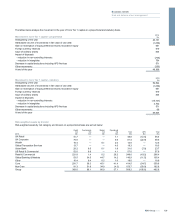
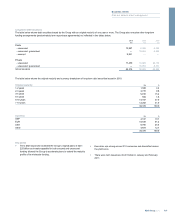
Credit Guarantee Scheme
The table below shows the residual maturity of the Group’s outstanding term funding issued under the UK Government’s Credit Guarantee Scheme at
31 December 2010.
Residual maturity £m %
Q1 2011 196 0.5
Q2 2011 1,224 2.9
Q4 2011 18,728 45.2
Q1 2012 15,593 37.6
Q2 2012 5,714 13.8
41,455 100.0
Key points
xThe Group had £41.5 billion outstanding at 31 December 2010
(2009 - £45.2 billion) of which £20.1 billion matures in 2011.
xThe Group’s funding plan for 2011 incorporates these maturities
along with other structural balance sheet changes.
Special Liquidity Scheme*
The Group does not use the Special Liquidity Scheme (SLS) to fund its
business activities. The Group’s outstanding liabilities under the SLS are
used to fund elements of its liquidity portfolio. Balances under the SLS
continued to reduce in 2010.
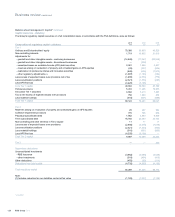
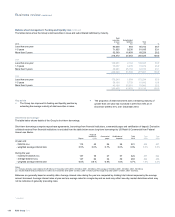
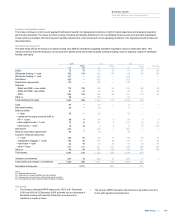
Liquidity portfolio
The table belowshows the composition of the Group’s liquidity portfolio.
The Group has refined the presentation of this portfolio. Treasury bills
and other government bonds which were previously reported under the
central Group Treasury portfolio, as well as unencumbered collateral and
other liquid assets are now included in their respective asset classes.
Liquidity portfolio 2010
£m
2009
£m
Cash and balances at central banks 53,661 51,500
Treasury bills 14,529 30,010
Central and local government bonds (1)
-AAA rated governments (2) 41,435 30,140
-AA- to AA+ rated governments 3,744 2,011
-governments rated below AA 1,029 1,630
-local government 5,672 5,706
51,880 39,487
Unencumbered collateral (3)
-AAA rated 17,836 20,246
-below AAA rated and other high quality assets 16,693 29,418
34,529 49,664
Total liquidity portfolio 154,599 170,661
Notes:
(1) Includes FSA eligible government bonds of £34.7 billion at 31 December 2010.
(2) Includes AAA rated US government guaranteed agencies.
(3) Includes secured assets which are eligible for discounting at central banks, comprising loans and advances and debt securities.
Key points
xThe liquidity portfolio at the end of 2009 reflects the build up of liquid
assets ahead of the legal separation of RBS N.V. and ABN AMRO in
April 2010. Following the separation, the liquid assets and
associated short-term wholesale funding were managed down to
business as usual levels.
xThe Group has maintained its liquidity portfolio at or near its
strategic target of £150 billion. The final level of the reserves will be
influenced by balance sheet size, maturity profile and regulatory
requirements.
xThe Group anticipates that the composition of the liquidity portfolio
will vary over time based on changing regulatory requirements and
internal evaluation of liquidity needs under stress.
*unaudited
RBS Group 2010138
Business review continued