RBS 2010 Annual Report Download - page 299
Download and view the complete annual report
Please find page 299 of the 2010 RBS annual report below. You can navigate through the pages in the report by either clicking on the pages listed below, or by using the keyword search tool below to find specific information within the annual report.-
 1
1 -
2
-
3
-
4
-
5
-
6
-
7
-
8
-
9
-
10
-
11
-
12
-
13
-
14
-
15
-
16
-
17
-
18
-
19
-
20
-
21
-
22
-
23
-
24
-
25
-
26
-
27
-
28
-
29
-
30
-
31
-
32
-
33
-
34
-
35
-
36
-
37
-
38
-
39
-
40
-
41
-
42
-
43
-
44
-
45
-
46
-
47
-
48
-
49
-
50
-
51
-
52
-
53
-
54
-
55
-
56
-
57
-
58
-
59
-
60
-
61
-
62
-
63
-
64
-
65
-
66
-
67
-
68
-
69
-
70
-
71
-
72
-
73
-
74
-
75
-
76
-
77
-
78
-
79
-
80
-
81
-
82
-
83
-
84
-
85
-
86
-
87
-
88
-
89
-
90
-
91
-
92
-
93
-
94
-
95
-
96
-
97
-
98
-
99
-
100
-
101
-
102
-
103
-
104
-
105
-
106
-
107
-
108
-
109
-
110
-
111
-
112
-
113
-
114
-
115
-
116
-
117
-
118
-
119
-
120
-
121
-
122
-
123
-
124
-
125
-
126
-
127
-
128
-
129
-
130
-
131
-
132
-
133
-
134
-
135
-
136
-
137
-
138
-
139
-
140
-
141
-
142
-
143
-
144
-
145
-
146
-
147
-
148
-
149
-
150
-
151
-
152
-
153
-
154
-
155
-
156
-
157
-
158
-
159
-
160
-
161
-
162
-
163
-
164
-
165
-
166
-
167
-
168
-
169
-
170
-
171
-
172
-
173
-
174
-
175
-
176
-
177
-
178
-
179
-
180
-
181
-
182
-
183
-
184
-
185
-
186
-
187
-
188
-
189
-
190
-
191
-
192
-
193
-
194
-
195
-
196
-
197
-
198
-
199
-
200
-
201
-
202
-
203
-
204
-
205
-
206
-
207
-
208
-
209
-
210
-
211
-
212
-
213
-
214
-
215
-
216
-
217
-
218
-
219
-
220
-
221
-
222
-
223
-
224
-
225
-
226
-
227
-
228
-
229
-
230
-
231
-
232
-
233
-
234
-
235
-
236
-
237
-
238
-
239
-
240
-
241
-
242
-
243
-
244
-
245
-
246
-
247
-
248
-
249
-
250
-
251
-
252
-
253
-
254
-
255
-
256
-
257
-
258
-
259
-
260
-
261
-
262
-
263
-
264
-
265
-
266
-
267
-
268
-
269
-
270
-
271
-
272
-
273
-
274
-
275
-
276
-
277
-
278
-
279
-
280
-
281
-
282
-
283
-
284
-
285
-
286
-
287
-
288
-
 289
289 -
 290
290 -
 291
291 -
 292
292 -
 293
293 -
 294
294 -
 295
295 -
 296
296 -
 297
297 -
 298
298 -
 299
299 -
 300
300 -
 301
301 -
 302
302 -
 303
303 -
 304
304 -
 305
305 -
 306
306 -
 307
307 -
 308
308 -
 309
309 -
310
-
311
-
312
-
313
-
314
-
315
-
316
-
317
-
318
-
319
-
320
-
321
-
322
-
323
-
324
-
325
-
326
-
327
-
328
-
329
-
330
-
331
-
332
-
333
-
334
-
335
-
336
-
337
-
338
-
339
-
340
-
341
-
342
-
343
-
344
-
345
-
346
-
347
-
348
-
349
-
350
-
351
-
352
-
353
-
354
-
355
-
356
-
357
-
358
-
359
-
360
-
361
-
362
-
363
-
364
-
365
-
366
-
367
-
368
-
369
-
370
-
371
-
372
-
373
-
374
-
375
-
376
-
377
-
378
-
379
-
380
-
381
-
382
-
383
-
384
-
385
-
386
-
387
-
388
-
389
-
390
-
391
-
392
-
393
-
394
-
395
-
396
-
397
-
398
-
399
-
400
-
401
-
402
-
403
-
404
-
405
-
406
-
407
-
408
-
409
-
410
-
411
-
412
-
413
-
414
-
415
-
416
-
417
-
418
-
419
-
420
-
421
-
422
-
423
-
424
-
425
-
426
-
427
-
428
-
429
-
430
-
431
-
432
-
433
-
434
-
435
-
436
-
437
-
438
-
439
-
440
-
441
-
442
-
443
-
444
-
445
 |
 |

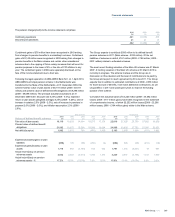
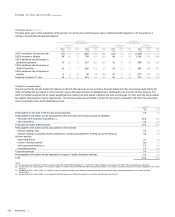
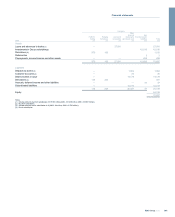
6 Tax
Group
2010 2009 2008
£m £m £m
Current tax
Charge for the year (251) (494) (1,386)
Over provision in respect of prior periods 41 191 254
Relief for overseas tax —— 34
(210) (303) (1,098)
Deferred tax
(Charge)/credit for the year (738) 1,041 3,167
Over/(under) provision in respect of prior periods 314 (309) 98
Tax (charge)/credit for the year (634) 429 2,167
The actual tax (charge)/credit differs from the expected tax credit computed by applying the standard rate of UK corporation tax of 28% (2009 - 28%;
2008 - 28.5%) as follows:
2010 2009 2008
£m £m £m
Expected tax credit 112 741 7,322
Non-deductible goodwill impairment (3) (102) (3,826)
Unrecognised timing differences 11 274 (274)
Items not allowed for tax
- losses on strategic disposals and write-downs (311) (152) (108)
- other (328) (356) (270)
Non-taxable items
-gain on sale of Global Merchant Services 221 — —
-gain on redemption of own debt 11 693 —
-other 341 410 491
Taxable foreign exchange movements 41 (80)
Foreign profits taxed at other rates (517) (276) (509)
UK tax rate change - deferred tax impact (82) — —
Losses in year where no deferred tax asset recognised (450) (780) (942)
Losses brought forward and utilised 294 11
Adjustments in respect of prior years (1) 355 (118) 352
Actual tax (charge)/credit (634) 429 2,167
Notes:
(1) Prior year tax adjustments include releases of tax provisions in respect of structured transactions and investment disposals, and adjustments to reflect submitted tax computations in the UK and
overseas.
(2) In the Budget on 22 June 2010, the UK Government proposed, amongst other things, to reduce Corporation Tax rates in four annual decrements of 1% with effect from 1 April 2011. The first
decrement was enacted in the Finance (No 2) Act 2010 and as a consequence the closing deferred tax assets and liabilities have been recognised at an effective rate of 27%. The impact of this
change on the tax charge for the year is set out in the table above.
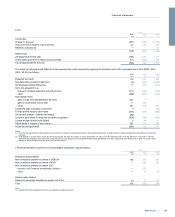
7 Profit attributable to preference shareholders and paid-in equity holders
Group
2010
£m
2009
£m
2008
£m
Preference shareholders
Non-cumulative preference shares of US$0.01 105 342 293
Non-cumulative preference shares of €0.01 —201 183
Non-cumulative preference shares of £1
-issued to UK Financial Investments Limited (1) —274 —
-other —61 60
Paid-in equity holders
Interest on securities classified as equity, net of tax 19 57 60
Total 124 935 596
Note:
(1) Includes £50 million redemption premium on repayment of preference shares.
297RBS Group 2010
Financial statements