RBS 2010 Annual Report Download - page 211
Download and view the complete annual report
Please find page 211 of the 2010 RBS annual report below. You can navigate through the pages in the report by either clicking on the pages listed below, or by using the keyword search tool below to find specific information within the annual report.-
 1
1 -
2
-
3
-
4
-
5
-
6
-
7
-
8
-
9
-
10
-
11
-
12
-
13
-
14
-
15
-
16
-
17
-
18
-
19
-
20
-
21
-
22
-
23
-
24
-
25
-
26
-
27
-
28
-
29
-
30
-
31
-
32
-
33
-
34
-
35
-
36
-
37
-
38
-
39
-
40
-
41
-
42
-
43
-
44
-
45
-
46
-
47
-
48
-
49
-
50
-
51
-
52
-
53
-
54
-
55
-
56
-
57
-
58
-
59
-
60
-
61
-
62
-
63
-
64
-
65
-
66
-
67
-
68
-
69
-
70
-
71
-
72
-
73
-
74
-
75
-
76
-
77
-
78
-
79
-
80
-
81
-
82
-
83
-
84
-
85
-
86
-
87
-
88
-
89
-
90
-
91
-
92
-
93
-
94
-
95
-
96
-
97
-
98
-
99
-
100
-
101
-
102
-
103
-
104
-
105
-
106
-
107
-
108
-
109
-
110
-
111
-
112
-
113
-
114
-
115
-
116
-
117
-
118
-
119
-
120
-
121
-
122
-
123
-
124
-
125
-
126
-
127
-
128
-
129
-
130
-
131
-
132
-
133
-
134
-
135
-
136
-
137
-
138
-
139
-
140
-
141
-
142
-
143
-
144
-
145
-
146
-
147
-
148
-
149
-
150
-
151
-
152
-
153
-
154
-
155
-
156
-
157
-
158
-
159
-
160
-
161
-
162
-
163
-
164
-
165
-
166
-
167
-
168
-
169
-
170
-
171
-
172
-
173
-
174
-
175
-
176
-
177
-
178
-
179
-
180
-
181
-
182
-
183
-
184
-
185
-
186
-
187
-
188
-
189
-
190
-
191
-
192
-
193
-
194
-
195
-
196
-
197
-
198
-
199
-
200
-
 201
201 -
 202
202 -
 203
203 -
 204
204 -
 205
205 -
 206
206 -
 207
207 -
 208
208 -
 209
209 -
 210
210 -
 211
211 -
 212
212 -
 213
213 -
 214
214 -
 215
215 -
 216
216 -
 217
217 -
 218
218 -
 219
219 -
 220
220 -
 221
221 -
222
-
223
-
224
-
225
-
226
-
227
-
228
-
229
-
230
-
231
-
232
-
233
-
234
-
235
-
236
-
237
-
238
-
239
-
240
-
241
-
242
-
243
-
244
-
245
-
246
-
247
-
248
-
249
-
250
-
251
-
252
-
253
-
254
-
255
-
256
-
257
-
258
-
259
-
260
-
261
-
262
-
263
-
264
-
265
-
266
-
267
-
268
-
269
-
270
-
271
-
272
-
273
-
274
-
275
-
276
-
277
-
278
-
279
-
280
-
281
-
282
-
283
-
284
-
285
-
286
-
287
-
288
-
289
-
290
-
291
-
292
-
293
-
294
-
295
-
296
-
297
-
298
-
299
-
300
-
301
-
302
-
303
-
304
-
305
-
306
-
307
-
308
-
309
-
310
-
311
-
312
-
313
-
314
-
315
-
316
-
317
-
318
-
319
-
320
-
321
-
322
-
323
-
324
-
325
-
326
-
327
-
328
-
329
-
330
-
331
-
332
-
333
-
334
-
335
-
336
-
337
-
338
-
339
-
340
-
341
-
342
-
343
-
344
-
345
-
346
-
347
-
348
-
349
-
350
-
351
-
352
-
353
-
354
-
355
-
356
-
357
-
358
-
359
-
360
-
361
-
362
-
363
-
364
-
365
-
366
-
367
-
368
-
369
-
370
-
371
-
372
-
373
-
374
-
375
-
376
-
377
-
378
-
379
-
380
-
381
-
382
-
383
-
384
-
385
-
386
-
387
-
388
-
389
-
390
-
391
-
392
-
393
-
394
-
395
-
396
-
397
-
398
-
399
-
400
-
401
-
402
-
403
-
404
-
405
-
406
-
407
-
408
-
409
-
410
-
411
-
412
-
413
-
414
-
415
-
416
-
417
-
418
-
419
-
420
-
421
-
422
-
423
-
424
-
425
-
426
-
427
-
428
-
429
-
430
-
431
-
432
-
433
-
434
-
435
-
436
-
437
-
438
-
439
-
440
-
441
-
442
-
443
-
444
-
445
 |
 |

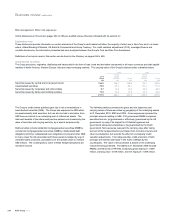
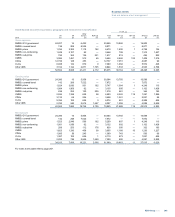
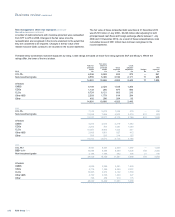
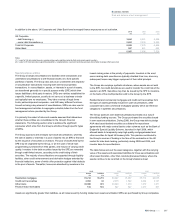
Non-investment grade and unrated ABS
The table below summarises the carrying values by accounting classification of non-investment grade or not publicly rated ABS.
Non-investment grade Unrated
HFT AFS LAR Total HFT AFS LAR Total
2010 £m £m £m £m £m £m £m £m
RMBS: prime 354 535 11 900 196 — — 196
RMBS: non-conforming 389 414 6 809 52 — — 52
RMBS: sub-prime 437 21 — 458 76 — — 76
CMBS 198 17 81 296 — — — —
CDOs 691 1,151 21 1,863 85 — — 85
CLOs 239 5 88 332 267 329 —596
Other ABS 148 17 100 265 191 162 345 698
2,456 2,160 307 4,923 867 491 345 1,703
2009
RMBS: prime 120 430 8 558 — 1 — 1
RMBS: non-conforming 253 341 — 594 — 2 — 2
RMBS: sub-prime 339 240 — 579 153 — — 153
CMBS 89 3 55 147 1 — 1 2
CDOs 487 300 62 849 143 119 — 262
CLOs 269 359 8 636 207 523 — 730
Other ABS 78 63 11 152 270 134 395 799
1,635 1,736 144 3,515 774 779 396 1,949
2008
RMBS: G10 government —— — — 9 — — 9
RMBS: prime 59 47 — 106 2 — — 2
RMBS: non-conforming 69 74 3 146 1 1 — 2
RMBS: sub-prime 636 124 30 790 1 — — 1
CMBS 38 — — 38 — — 1 1
CDOs 1,219 869 — 2,088 173 142 66 381
CLOs 80 188 — 268 165 279 5 449
Other ABS 122 49 71 242 115 404 810 1,329
2,223 1,351 104 3,678 466 826 882 2,174
Key point
xNon-investment grade securities increased by £1.4 billion of which £1.0 billion was in CDOs reflecting purchases by GBM’s Mortgage Trading
business as well as credit down grades and rating withdrawals of certain ABS structures in Non-Core during the year.
209RBS Group 2010
Business review
Risk and balance sheet management