RBS 2010 Annual Report Download - page 349
Download and view the complete annual report
Please find page 349 of the 2010 RBS annual report below. You can navigate through the pages in the report by either clicking on the pages listed below, or by using the keyword search tool below to find specific information within the annual report.-
 1
1 -
2
-
3
-
4
-
5
-
6
-
7
-
8
-
9
-
10
-
11
-
12
-
13
-
14
-
15
-
16
-
17
-
18
-
19
-
20
-
21
-
22
-
23
-
24
-
25
-
26
-
27
-
28
-
29
-
30
-
31
-
32
-
33
-
34
-
35
-
36
-
37
-
38
-
39
-
40
-
41
-
42
-
43
-
44
-
45
-
46
-
47
-
48
-
49
-
50
-
51
-
52
-
53
-
54
-
55
-
56
-
57
-
58
-
59
-
60
-
61
-
62
-
63
-
64
-
65
-
66
-
67
-
68
-
69
-
70
-
71
-
72
-
73
-
74
-
75
-
76
-
77
-
78
-
79
-
80
-
81
-
82
-
83
-
84
-
85
-
86
-
87
-
88
-
89
-
90
-
91
-
92
-
93
-
94
-
95
-
96
-
97
-
98
-
99
-
100
-
101
-
102
-
103
-
104
-
105
-
106
-
107
-
108
-
109
-
110
-
111
-
112
-
113
-
114
-
115
-
116
-
117
-
118
-
119
-
120
-
121
-
122
-
123
-
124
-
125
-
126
-
127
-
128
-
129
-
130
-
131
-
132
-
133
-
134
-
135
-
136
-
137
-
138
-
139
-
140
-
141
-
142
-
143
-
144
-
145
-
146
-
147
-
148
-
149
-
150
-
151
-
152
-
153
-
154
-
155
-
156
-
157
-
158
-
159
-
160
-
161
-
162
-
163
-
164
-
165
-
166
-
167
-
168
-
169
-
170
-
171
-
172
-
173
-
174
-
175
-
176
-
177
-
178
-
179
-
180
-
181
-
182
-
183
-
184
-
185
-
186
-
187
-
188
-
189
-
190
-
191
-
192
-
193
-
194
-
195
-
196
-
197
-
198
-
199
-
200
-
201
-
202
-
203
-
204
-
205
-
206
-
207
-
208
-
209
-
210
-
211
-
212
-
213
-
214
-
215
-
216
-
217
-
218
-
219
-
220
-
221
-
222
-
223
-
224
-
225
-
226
-
227
-
228
-
229
-
230
-
231
-
232
-
233
-
234
-
235
-
236
-
237
-
238
-
239
-
240
-
241
-
242
-
243
-
244
-
245
-
246
-
247
-
248
-
249
-
250
-
251
-
252
-
253
-
254
-
255
-
256
-
257
-
258
-
259
-
260
-
261
-
262
-
263
-
264
-
265
-
266
-
267
-
268
-
269
-
270
-
271
-
272
-
273
-
274
-
275
-
276
-
277
-
278
-
279
-
280
-
281
-
282
-
283
-
284
-
285
-
286
-
287
-
288
-
289
-
290
-
291
-
292
-
293
-
294
-
295
-
296
-
297
-
298
-
299
-
300
-
301
-
302
-
303
-
304
-
305
-
306
-
307
-
308
-
309
-
310
-
311
-
312
-
313
-
314
-
315
-
316
-
317
-
318
-
319
-
320
-
321
-
322
-
323
-
324
-
325
-
326
-
327
-
328
-
329
-
330
-
331
-
332
-
333
-
334
-
335
-
336
-
337
-
338
-
 339
339 -
 340
340 -
 341
341 -
 342
342 -
 343
343 -
 344
344 -
 345
345 -
 346
346 -
 347
347 -
 348
348 -
 349
349 -
 350
350 -
 351
351 -
 352
352 -
 353
353 -
 354
354 -
 355
355 -
 356
356 -
 357
357 -
 358
358 -
 359
359 -
360
-
361
-
362
-
363
-
364
-
365
-
366
-
367
-
368
-
369
-
370
-
371
-
372
-
373
-
374
-
375
-
376
-
377
-
378
-
379
-
380
-
381
-
382
-
383
-
384
-
385
-
386
-
387
-
388
-
389
-
390
-
391
-
392
-
393
-
394
-
395
-
396
-
397
-
398
-
399
-
400
-
401
-
402
-
403
-
404
-
405
-
406
-
407
-
408
-
409
-
410
-
411
-
412
-
413
-
414
-
415
-
416
-
417
-
418
-
419
-
420
-
421
-
422
-
423
-
424
-
425
-
426
-
427
-
428
-
429
-
430
-
431
-
432
-
433
-
434
-
435
-
436
-
437
-
438
-
439
-
440
-
441
-
442
-
443
-
444
-
445
 |
 |

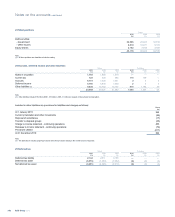
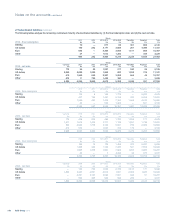
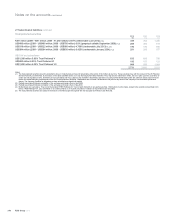
Insurance claims - gross
Accident year
2001
£m
2002
£m
2003
£m
2004
£m
2005
£m
2006
£m
2007
£m
2008
£m
2009
£m
2010
£m
Total
£m
Estimate of ultimate claims costs:
At end of accident year 2,395 3,013 3,658 3,710 4,265 4,269 4,621 4,080 4,383 4,459 38,853
One year later (70) 91 (140) (186) (92) (275) (71) 29 120 (594)
Two years later 20 1 (106) (88) (147) (77) (5) 9 (393)
Three years later 12 (12) (55) (85) (60) (16) 14 (202)
Four years later (40) (17) (47) (31) (55) 2 (188)
Five years later (1) (19) (21) — 9 (32)
Six years later (9) (11) (32) 45 (7)
Seven years later 6(14) 28 20
Eight years later 414 18
Nine years later 9 9
Current estimate of cumulative
claims 2,326 3,046 3,285 3,365 3,920 3,903 4,559 4,118 4,503 4,459 37,484
Cumulative payments to date (2,256) (2,976) (3,144) (3,131) (3,670) (3,482) (3,902) (3,301) (3,157) (2,044) (31,063)
70 70 141 234 250 421 657 817 1,346 2,415 6,421
Liability in respect of earlier years 172
Claims handling costs 133
Gross general insurance claims liability 6,726
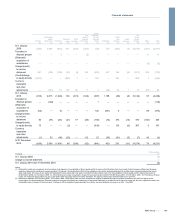
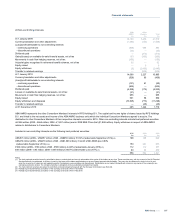
Insurance claims - net of reinsurance
Accident year
2001 2002 2003 2004 2005 2006 2007 2008 2009 2010 Total
£m £m £m £m £m £m £m £m £m £m £m
Estimate of ultimate claims costs:
At end of accident year 2,011 2,584 3,215 3,514 4,168 4,215 4,572 4,034 4,360 4,435 37,108
One year later (61) 59 (106) (168) (67) (261) (90) 24 99 (571)
Two years later 22 (12) (103) (90) (161) (87) (17) 9 (439)
Three years later 13 (3) (53) (81) (64) (23) 16 (195)
Four years later (41) (21) (44) (46) (60) 10 (202)
Five years later 1(24) (23) (19) 4 (61)
Six years later (19) (5) (34) 45 (13)
Seven years later —(11) 20 9
Eight years later 110 11
Nine years later 8 8
Current estimate of cumulative
claims 1,935 2,577 2,872 3,155 3,820 3,854 4,481 4,067 4,459 4,435 35,655
Cumulative payments to date (1,887) (2,525) (2,786) (2,970) (3,590) (3,435) (3,849) (3,276) (3,133) (2,030) (29,481)
48 52 86 185 230 419 632 791 1,326 2,405 6,174
Liability in respect of earlier years 109
Claims handling costs 133
Net general insurance claims liability 6,416
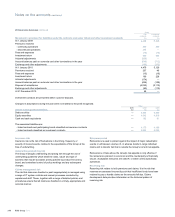
Claims reserves
It is the Group’s policy to hold claims reserves (including reserves to
cover claims which have been incurred but not reported (IBNR reserves))
for all classes at a sufficient level to meet all liabilities as they fall due.
The Group’s focus is on high volume and relatively straightforward
products, for example home and motor. This facilitates the generation of
comprehensive underwriting and claims data, which are used to
accurately price and monitor the risks accepted.
347RBS Group 2010
Financial statements