RBS 2010 Annual Report Download - page 155
Download and view the complete annual report
Please find page 155 of the 2010 RBS annual report below. You can navigate through the pages in the report by either clicking on the pages listed below, or by using the keyword search tool below to find specific information within the annual report.-
 1
1 -
2
-
3
-
4
-
5
-
6
-
7
-
8
-
9
-
10
-
11
-
12
-
13
-
14
-
15
-
16
-
17
-
18
-
19
-
20
-
21
-
22
-
23
-
24
-
25
-
26
-
27
-
28
-
29
-
30
-
31
-
32
-
33
-
34
-
35
-
36
-
37
-
38
-
39
-
40
-
41
-
42
-
43
-
44
-
45
-
46
-
47
-
48
-
49
-
50
-
51
-
52
-
53
-
54
-
55
-
56
-
57
-
58
-
59
-
60
-
61
-
62
-
63
-
64
-
65
-
66
-
67
-
68
-
69
-
70
-
71
-
72
-
73
-
74
-
75
-
76
-
77
-
78
-
79
-
80
-
81
-
82
-
83
-
84
-
85
-
86
-
87
-
88
-
89
-
90
-
91
-
92
-
93
-
94
-
95
-
96
-
97
-
98
-
99
-
100
-
101
-
102
-
103
-
104
-
105
-
106
-
107
-
108
-
109
-
110
-
111
-
112
-
113
-
114
-
115
-
116
-
117
-
118
-
119
-
120
-
121
-
122
-
123
-
124
-
125
-
126
-
127
-
128
-
129
-
130
-
131
-
132
-
133
-
134
-
135
-
136
-
137
-
138
-
139
-
140
-
141
-
142
-
143
-
144
-
 145
145 -
 146
146 -
 147
147 -
 148
148 -
 149
149 -
 150
150 -
 151
151 -
 152
152 -
 153
153 -
 154
154 -
 155
155 -
 156
156 -
 157
157 -
 158
158 -
 159
159 -
 160
160 -
 161
161 -
 162
162 -
 163
163 -
 164
164 -
 165
165 -
166
-
167
-
168
-
169
-
170
-
171
-
172
-
173
-
174
-
175
-
176
-
177
-
178
-
179
-
180
-
181
-
182
-
183
-
184
-
185
-
186
-
187
-
188
-
189
-
190
-
191
-
192
-
193
-
194
-
195
-
196
-
197
-
198
-
199
-
200
-
201
-
202
-
203
-
204
-
205
-
206
-
207
-
208
-
209
-
210
-
211
-
212
-
213
-
214
-
215
-
216
-
217
-
218
-
219
-
220
-
221
-
222
-
223
-
224
-
225
-
226
-
227
-
228
-
229
-
230
-
231
-
232
-
233
-
234
-
235
-
236
-
237
-
238
-
239
-
240
-
241
-
242
-
243
-
244
-
245
-
246
-
247
-
248
-
249
-
250
-
251
-
252
-
253
-
254
-
255
-
256
-
257
-
258
-
259
-
260
-
261
-
262
-
263
-
264
-
265
-
266
-
267
-
268
-
269
-
270
-
271
-
272
-
273
-
274
-
275
-
276
-
277
-
278
-
279
-
280
-
281
-
282
-
283
-
284
-
285
-
286
-
287
-
288
-
289
-
290
-
291
-
292
-
293
-
294
-
295
-
296
-
297
-
298
-
299
-
300
-
301
-
302
-
303
-
304
-
305
-
306
-
307
-
308
-
309
-
310
-
311
-
312
-
313
-
314
-
315
-
316
-
317
-
318
-
319
-
320
-
321
-
322
-
323
-
324
-
325
-
326
-
327
-
328
-
329
-
330
-
331
-
332
-
333
-
334
-
335
-
336
-
337
-
338
-
339
-
340
-
341
-
342
-
343
-
344
-
345
-
346
-
347
-
348
-
349
-
350
-
351
-
352
-
353
-
354
-
355
-
356
-
357
-
358
-
359
-
360
-
361
-
362
-
363
-
364
-
365
-
366
-
367
-
368
-
369
-
370
-
371
-
372
-
373
-
374
-
375
-
376
-
377
-
378
-
379
-
380
-
381
-
382
-
383
-
384
-
385
-
386
-
387
-
388
-
389
-
390
-
391
-
392
-
393
-
394
-
395
-
396
-
397
-
398
-
399
-
400
-
401
-
402
-
403
-
404
-
405
-
406
-
407
-
408
-
409
-
410
-
411
-
412
-
413
-
414
-
415
-
416
-
417
-
418
-
419
-
420
-
421
-
422
-
423
-
424
-
425
-
426
-
427
-
428
-
429
-
430
-
431
-
432
-
433
-
434
-
435
-
436
-
437
-
438
-
439
-
440
-
441
-
442
-
443
-
444
-
445
 |
 |

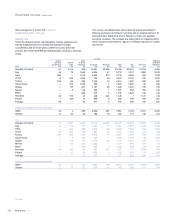
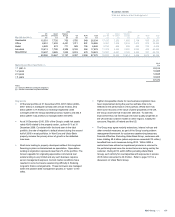
Key points
xCredit risk assets relating to most of the countries above declined in
2010, reflecting active exposure management. In addition to the
overall exposure reductions, granular portfolio reviews have been
and continue to be undertaken with a view to adjusting the tenor
profile and better alignment of the Group’s country risk appetite to
the risk of adverse economic and political developments.
xReductions were seen in corporate and personal exposures,
particularly in the Non-Core portfolios. This contrasted with
increases in financial institutions in a number of countries, mostly
due to increases in RRM exposure. Some countries in Asia have
seen increased exposures during 2010, including two of the Group’s
strategically important countries in this region, China and India,
following reductions in 2008 and 2009.
xThe Group broadened its country risk framework in 2010, to capture
advanced as well as emerging market countries. Cross-country
assessments were conducted to identify portfolio vulnerabilities to a
number of risk scenarios, including a eurozone sovereign debt crisis.
Limit controls are being applied on a risk differentiated basis and
selected exposure actions have been taken. Further scenario stress
testing is continuing, and covers the potential for economic and
political shocks in the eurozone and in the broader global
environment.
xFor selected eurozone countries, the general trend in lending was
lower, due in part to a depreciation of the euro against sterling by
3% over the year.
xRepublic of Ireland (ROI): lending fell by £4.3 billion in 2010,
resulting from reductions in personal lending by £2.1 billion, central
banks and other financial institutions by £0.5 billion and corporate
clients by £1.6 billion. An increase was seen in Ulster Bank’s central
bank exposure due to higher cash balances as part of its liquidity
portfolio. The general trend in exposure remains downward.
Divisional analysis is set out below:
xUlster Bank represents more than 95% (£32 billion) of the
Group’s Core lending to ROI and has seen a minimal increase
of £0.64 billion in 2010, largely because of a rise of £0.3 billion
in central bank placing due to increased cash holdings. Ulster
Bank Core provisions at 31 December 2010 increased by 70%
due to the continuing deterioration in the Irish economy.
xNon-Core lending to ROI (£10.8 billion) declined by £4.2 billion
in 2010, mainly due to a reduction in exposure to corporate and
financial institutions of £3 billion during the year. In addition,
customer advances in Lombard Ireland decreased by 30%
during the year to £0.9 billion. Overall default levels have
continued to show signs of stabilisation.
xGlobal Banking & Markets (GBM) accounts for a further £0.6
billion of the Core lending exposure, largely relating to domestic
and foreign owned financial institutions. In addition, overall
limits to the major Irish domestic banks have halved since 31
December 2008 to £1.2 billion, with the majority representing
collateralised RRM or guarantees for third-party obligations.
Overall credit quality remains acceptable with a majority of the
exposure to investment grade entities.
xSpain: lending fell by £0.9 billion, due to a reduction in corporate
activity. During the fourth quarter, this reduction accelerated. Non-
Core represents 59% of the Group’s total exposure to Spain in 2010
(2009 - 65%). In the course of 2010, progress was made towards
increased collateralisation of the portfolio.
xItaly: lending decreased by £1.7 billion, as a result of a net reduction
in corporate lending of £2.0 billion and an increase to financial
institutions of £0.3 billion. In addition, there was an increase in RRM
exposure to financial institutions by £0.7 billion; the non-lending
portfolio is comprised predominantly of collateralised trading activity.
xPortugal: lending decreased slightly by £0.1 billion related to
reductions in corporate activity. Non-Core represents 41% of the
total exposure; the structure of the exposure was enhanced through
ashift to short-term and collateralised products to support the
hedging needs of customers.
xGreece: lending fell by £0.1 billion, due to a reduction in corporate
activity. Continuous close scrutiny of the portfolio throughout the
year and divestment of selected assets have improved the overall
quality of the portfolio, available-for-sale (AFS) debt securities
represent the primary concentration.
xTotal exposure to Egypt was £253 million at 31 December 2010,
including lending of £124 million. The Group has minimal exposures
to North African countries.
153RBS Group 2010
Business review
Risk and balance sheet management