RBS 2010 Annual Report Download - page 339
Download and view the complete annual report
Please find page 339 of the 2010 RBS annual report below. You can navigate through the pages in the report by either clicking on the pages listed below, or by using the keyword search tool below to find specific information within the annual report.-
 1
1 -
2
-
3
-
4
-
5
-
6
-
7
-
8
-
9
-
10
-
11
-
12
-
13
-
14
-
15
-
16
-
17
-
18
-
19
-
20
-
21
-
22
-
23
-
24
-
25
-
26
-
27
-
28
-
29
-
30
-
31
-
32
-
33
-
34
-
35
-
36
-
37
-
38
-
39
-
40
-
41
-
42
-
43
-
44
-
45
-
46
-
47
-
48
-
49
-
50
-
51
-
52
-
53
-
54
-
55
-
56
-
57
-
58
-
59
-
60
-
61
-
62
-
63
-
64
-
65
-
66
-
67
-
68
-
69
-
70
-
71
-
72
-
73
-
74
-
75
-
76
-
77
-
78
-
79
-
80
-
81
-
82
-
83
-
84
-
85
-
86
-
87
-
88
-
89
-
90
-
91
-
92
-
93
-
94
-
95
-
96
-
97
-
98
-
99
-
100
-
101
-
102
-
103
-
104
-
105
-
106
-
107
-
108
-
109
-
110
-
111
-
112
-
113
-
114
-
115
-
116
-
117
-
118
-
119
-
120
-
121
-
122
-
123
-
124
-
125
-
126
-
127
-
128
-
129
-
130
-
131
-
132
-
133
-
134
-
135
-
136
-
137
-
138
-
139
-
140
-
141
-
142
-
143
-
144
-
145
-
146
-
147
-
148
-
149
-
150
-
151
-
152
-
153
-
154
-
155
-
156
-
157
-
158
-
159
-
160
-
161
-
162
-
163
-
164
-
165
-
166
-
167
-
168
-
169
-
170
-
171
-
172
-
173
-
174
-
175
-
176
-
177
-
178
-
179
-
180
-
181
-
182
-
183
-
184
-
185
-
186
-
187
-
188
-
189
-
190
-
191
-
192
-
193
-
194
-
195
-
196
-
197
-
198
-
199
-
200
-
201
-
202
-
203
-
204
-
205
-
206
-
207
-
208
-
209
-
210
-
211
-
212
-
213
-
214
-
215
-
216
-
217
-
218
-
219
-
220
-
221
-
222
-
223
-
224
-
225
-
226
-
227
-
228
-
229
-
230
-
231
-
232
-
233
-
234
-
235
-
236
-
237
-
238
-
239
-
240
-
241
-
242
-
243
-
244
-
245
-
246
-
247
-
248
-
249
-
250
-
251
-
252
-
253
-
254
-
255
-
256
-
257
-
258
-
259
-
260
-
261
-
262
-
263
-
264
-
265
-
266
-
267
-
268
-
269
-
270
-
271
-
272
-
273
-
274
-
275
-
276
-
277
-
278
-
279
-
280
-
281
-
282
-
283
-
284
-
285
-
286
-
287
-
288
-
289
-
290
-
291
-
292
-
293
-
294
-
295
-
296
-
297
-
298
-
299
-
300
-
301
-
302
-
303
-
304
-
305
-
306
-
307
-
308
-
309
-
310
-
311
-
312
-
313
-
314
-
315
-
316
-
317
-
318
-
319
-
320
-
321
-
322
-
323
-
324
-
325
-
326
-
327
-
328
-
 329
329 -
 330
330 -
 331
331 -
 332
332 -
 333
333 -
 334
334 -
 335
335 -
 336
336 -
 337
337 -
 338
338 -
 339
339 -
 340
340 -
 341
341 -
 342
342 -
 343
343 -
 344
344 -
 345
345 -
 346
346 -
 347
347 -
 348
348 -
 349
349 -
350
-
351
-
352
-
353
-
354
-
355
-
356
-
357
-
358
-
359
-
360
-
361
-
362
-
363
-
364
-
365
-
366
-
367
-
368
-
369
-
370
-
371
-
372
-
373
-
374
-
375
-
376
-
377
-
378
-
379
-
380
-
381
-
382
-
383
-
384
-
385
-
386
-
387
-
388
-
389
-
390
-
391
-
392
-
393
-
394
-
395
-
396
-
397
-
398
-
399
-
400
-
401
-
402
-
403
-
404
-
405
-
406
-
407
-
408
-
409
-
410
-
411
-
412
-
413
-
414
-
415
-
416
-
417
-
418
-
419
-
420
-
421
-
422
-
423
-
424
-
425
-
426
-
427
-
428
-
429
-
430
-
431
-
432
-
433
-
434
-
435
-
436
-
437
-
438
-
439
-
440
-
441
-
442
-
443
-
444
-
445
 |
 |

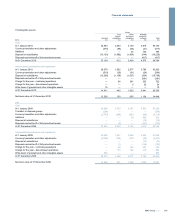
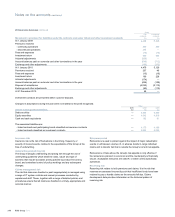
Impairment testing involves the comparison of the carrying value of a
CGU or group of CGUs with its recoverable amount. The recoverable
amount is the higher of the unit's fair value and its value in use. Value in
use is the present value of expected future cash flows from the CGU or
group of CGUs. Fair value is the amount obtainable for the sale of the
CGU in an arm's length transaction between knowledgeable, willing
parties.
Impairment testing inherently involves a number of judgmental areas: the
preparation of cash flow forecasts for periods that are beyond the normal
requirements of management reporting; the assessment of the discount
rate appropriate to the business; estimation of the fair value of CGUs;
and the valuation of the separable assets of each business whose
goodwill is being reviewed. Sensitivity to the variables more significant to
each assessment are presented below.
The recoverable amounts for all CGUs at 30 September 2010 were
based on the value in use test, using management's latest five-year
forecasts. The long-term growth rates have been based on respective
country GDP rates adjusted for inflation. The risk discount rates are
based on observable market long-term government bond yields and
average industry betas adjusted for an appropriate risk premium based
on independent analysis.
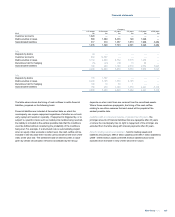
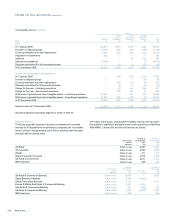
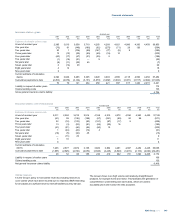
The recoverable amount of UK Retail, based on a 3% (2009 - 4%)
terminal growth rate and 15.7% (2009 - 14.6%) pre tax discount rate,
exceeded the carrying amount by £6.9 billion (2009 - £0.7 billion). A 1%
change in the discount rate or the terminal growth rate would change the
recoverable amount by approximately £1.5 billion (2009 - £0.9 billion) and
£0.9 billion (2009 - £0.5 billion) respectively. In addition, a 5% change in
the forecast pre tax earnings would change the recoverable amount by
approximately £0.9 billion (2009 - £0.4 billion).
The recoverable amount of UK Corporate, based on 3% (2009 - 4%)
terminal growth rate and a 15.6% (2009 - 15.1%) pre tax discount rate,
exceeded its carrying value by £5.3 billion (2009 - £6.1 billion). A 1%
change in the discount rate or the terminal growth rate would change the
recoverable amount by approximately £1.6 billion (2009 - £1.4 billion) and
£0.9 billion (2009 - £0.9 billion) respectively. In addition, a 5% change in
the forecast pre tax earnings would change the recoverable amount by
approximately £1.0 billion (2009 - £0.8 billion).
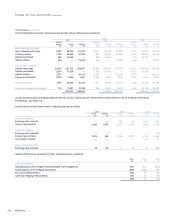
The recoverable amount of Wealth, based on a 3% (2009 - 4%) terminal
growth rate and a 12.0% (2009 - 15.3%) pre tax discount rate, exceeded
its carrying value by more than 100% and was insensitive to a reasonably
possible change in key assumptions.
The recoverable amount of Global Transaction Services, based on a 3%
(2009 - 3%) terminal growth rate and a 12.8% (2009 - 16.7%) pre tax
discount rate, exceeded its carrying value by more than 100% (2009 -
100%) and was insensitive to a reasonably possible change in key
assumptions.
The recoverable amount of US Retail & Commercial, based on a 5%
(2009 - 5%) terminal growth rate and a 14.9% (2009 - 14.8%) pre tax
discount rate, exceeded its carrying value by £1.6 billion (2009 - £2.1
billion). A 1% change in the discount rate or the terminal growth rate
would change the recoverable amount by approximately £1.6 billion
(2009 - £1.0 billion) and £0.8 billion (2009 - £0.8 billion) respectively. In
addition, a 5% change in the forecast pre tax earnings would change the
recoverable amount by approximately £0.7 billion (2009 - £0.7 billion).
The recoverable amount of RBS Insurance, based on a 3% (2009 - 3%)
terminal growth rate and a 13.1% (2009 - 13.9%) pre tax discount rate,
exceeded the carrying amount by over £2.4 billion (2009 - £3.0 billion)
and was insensitive to a reasonably possible change in key assumptions.
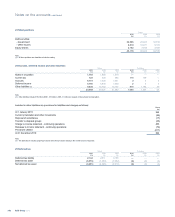
In 2008, the recoverable amounts for all CGUs were based on value in
use tests. Goodwill write downs were recorded in Global Banking &
Markets, US Retail & Commercial, Europe & Middle East Retail &
Commercial Banking and Asia Retail & Commercial Banking divisions. In
addition, an impairment charge of £14.5 billion was recorded in respect of
goodwill attributable to the State of Netherlands minority interest arising
on the acquisition of ABN AMRO.
337RBS Group 2010
Financial statements