RBS 2010 Annual Report Download - page 159
Download and view the complete annual report
Please find page 159 of the 2010 RBS annual report below. You can navigate through the pages in the report by either clicking on the pages listed below, or by using the keyword search tool below to find specific information within the annual report.-
 1
1 -
2
-
3
-
4
-
5
-
6
-
7
-
8
-
9
-
10
-
11
-
12
-
13
-
14
-
15
-
16
-
17
-
18
-
19
-
20
-
21
-
22
-
23
-
24
-
25
-
26
-
27
-
28
-
29
-
30
-
31
-
32
-
33
-
34
-
35
-
36
-
37
-
38
-
39
-
40
-
41
-
42
-
43
-
44
-
45
-
46
-
47
-
48
-
49
-
50
-
51
-
52
-
53
-
54
-
55
-
56
-
57
-
58
-
59
-
60
-
61
-
62
-
63
-
64
-
65
-
66
-
67
-
68
-
69
-
70
-
71
-
72
-
73
-
74
-
75
-
76
-
77
-
78
-
79
-
80
-
81
-
82
-
83
-
84
-
85
-
86
-
87
-
88
-
89
-
90
-
91
-
92
-
93
-
94
-
95
-
96
-
97
-
98
-
99
-
100
-
101
-
102
-
103
-
104
-
105
-
106
-
107
-
108
-
109
-
110
-
111
-
112
-
113
-
114
-
115
-
116
-
117
-
118
-
119
-
120
-
121
-
122
-
123
-
124
-
125
-
126
-
127
-
128
-
129
-
130
-
131
-
132
-
133
-
134
-
135
-
136
-
137
-
138
-
139
-
140
-
141
-
142
-
143
-
144
-
145
-
146
-
147
-
148
-
 149
149 -
 150
150 -
 151
151 -
 152
152 -
 153
153 -
 154
154 -
 155
155 -
 156
156 -
 157
157 -
 158
158 -
 159
159 -
 160
160 -
 161
161 -
 162
162 -
 163
163 -
 164
164 -
 165
165 -
 166
166 -
 167
167 -
 168
168 -
 169
169 -
170
-
171
-
172
-
173
-
174
-
175
-
176
-
177
-
178
-
179
-
180
-
181
-
182
-
183
-
184
-
185
-
186
-
187
-
188
-
189
-
190
-
191
-
192
-
193
-
194
-
195
-
196
-
197
-
198
-
199
-
200
-
201
-
202
-
203
-
204
-
205
-
206
-
207
-
208
-
209
-
210
-
211
-
212
-
213
-
214
-
215
-
216
-
217
-
218
-
219
-
220
-
221
-
222
-
223
-
224
-
225
-
226
-
227
-
228
-
229
-
230
-
231
-
232
-
233
-
234
-
235
-
236
-
237
-
238
-
239
-
240
-
241
-
242
-
243
-
244
-
245
-
246
-
247
-
248
-
249
-
250
-
251
-
252
-
253
-
254
-
255
-
256
-
257
-
258
-
259
-
260
-
261
-
262
-
263
-
264
-
265
-
266
-
267
-
268
-
269
-
270
-
271
-
272
-
273
-
274
-
275
-
276
-
277
-
278
-
279
-
280
-
281
-
282
-
283
-
284
-
285
-
286
-
287
-
288
-
289
-
290
-
291
-
292
-
293
-
294
-
295
-
296
-
297
-
298
-
299
-
300
-
301
-
302
-
303
-
304
-
305
-
306
-
307
-
308
-
309
-
310
-
311
-
312
-
313
-
314
-
315
-
316
-
317
-
318
-
319
-
320
-
321
-
322
-
323
-
324
-
325
-
326
-
327
-
328
-
329
-
330
-
331
-
332
-
333
-
334
-
335
-
336
-
337
-
338
-
339
-
340
-
341
-
342
-
343
-
344
-
345
-
346
-
347
-
348
-
349
-
350
-
351
-
352
-
353
-
354
-
355
-
356
-
357
-
358
-
359
-
360
-
361
-
362
-
363
-
364
-
365
-
366
-
367
-
368
-
369
-
370
-
371
-
372
-
373
-
374
-
375
-
376
-
377
-
378
-
379
-
380
-
381
-
382
-
383
-
384
-
385
-
386
-
387
-
388
-
389
-
390
-
391
-
392
-
393
-
394
-
395
-
396
-
397
-
398
-
399
-
400
-
401
-
402
-
403
-
404
-
405
-
406
-
407
-
408
-
409
-
410
-
411
-
412
-
413
-
414
-
415
-
416
-
417
-
418
-
419
-
420
-
421
-
422
-
423
-
424
-
425
-
426
-
427
-
428
-
429
-
430
-
431
-
432
-
433
-
434
-
435
-
436
-
437
-
438
-
439
-
440
-
441
-
442
-
443
-
444
-
445
 |
 |

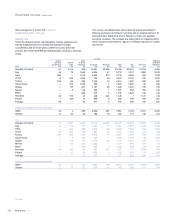
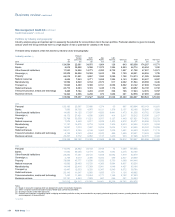
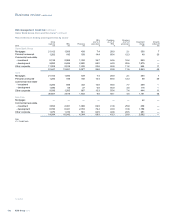
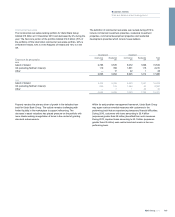
2010 2009
By sub-sector (1)
UK
(excl NI)
£m
Island
of Ireland
£m
Western
Europe
£m
US
£m
RoW
£m
Total
£m
UK
(excl NI)
£m
Island
of Ireland
£m
Western
Europe
£m
US
£m
RoW
£m
Total
£m
Residential 15,551 7,726 753 1,755 549 26,334 17,197 7,352 1,065 2,134 505 28,253
Office 8,551 1,402 4,431 1,311 891 16,586 9,381 1,536 5,034 1,614 975 18,540
Retail 4,928 674 711 529 106 6,948
5,760 686 998 492 700 8,636
Industrial 10,413 1,780 3,309 2,193 284 17,979 11,378 2,599 3,592 2,053 402 20,024
Mixed/Other 10,607 3,985 1,933 2,519 479 19,523 12,087 4,047 3,125 3,243 231 22,733
50,050 15,567 11,137 8,307 2,309 87,370 55,803 16,220 13,814 9,536 2,813 98,186
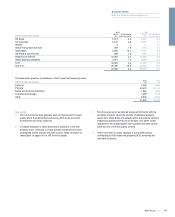
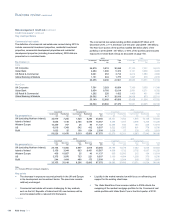
Maturity profile of portfolio (1) 2010
£m
< 1 year (2) 22,514
1-2 years 18,085
2-3 years 12,848
> 3 years 33,923
87,370
Notes:
(1) Excludes RRM and contingent obligations.
(2) Includes on demand and past due assets.
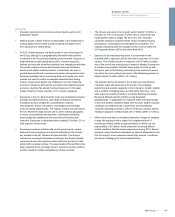
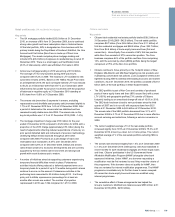
Key points
xOf the total portfolio at 31 December 2010, £45.5 billion (2009 -
£58.1 billion) is managed normally with annual reviews, £9.2
billion (2009 - £17.9 billion) is receiving heightened credit
oversight under the Group watchlist process (“watch”) and £32.6
billion (2009 - £22.2 billion) is managed within the GRG.
xAs at 31 December 2010, 55% of the Group’s credit risk assets
rated AQ10 related to the property sector, up from 51% at 31
December 2009. Consistent with the trend seen in the total
portfolio, the rate of migration to default slowed during the second
half of 2010 in most portfolios. In Non-Core and Ulster Bank
property remains the primary driver of growth in the defaulted
loan book.
xShort-term lending to property developers without firm long-term
financing in place is characterised as speculative. Speculative
lending at origination represents less than 2% of the portfolio. The
Group’s appetite for originating speculative commercial real
estate lending is very limited and any such business requires
senior management approval. Current market conditions have
resulted in some borrowers experiencing difficulty in finalising
long-term finance arrangements. These borrowers are managed
within the problem debt management process in “watch” or the
GRG.
xTighter risk appetite criteria for new business origination have
been implemented during the year but will take time to be
reflected in the performance of the portfolio. Whilst there has
been some recovery in the value of prime properties in the UK,
the Group observes that it has been selective. To date this
improvement has not fed through into lower quality properties in
the UK and has not been evident in other regions, notably the
eurozone, Republic of Ireland and the US.
xThe Group may agree maturity extensions, interest roll-ups and
other remedial measures, as part of the Group’s early problem
management framework for customers experiencing temporary
financial difficulties. Excluding Ulster Bank Group, customers with
loans totalling £0.6 billion (where exposures exceeded £10 million)
benefited from such measures during 2010. Within GRG a
restructured loan without an impairment provision is returned to
the performing book once the revised terms are being met by the
customer. During 2010, within GRG (excluding Ulster Bank
Group), such activity for counterparties with exposures in excess
of £5 million amounted to £0.3 billion. Refer to page 161 for a
discussion on Ulster Bank Group.
157RBS Group 2010
Business review
Risk and balance sheet management