RBS 2010 Annual Report Download - page 311
Download and view the complete annual report
Please find page 311 of the 2010 RBS annual report below. You can navigate through the pages in the report by either clicking on the pages listed below, or by using the keyword search tool below to find specific information within the annual report.-
 1
1 -
2
-
3
-
4
-
5
-
6
-
7
-
8
-
9
-
10
-
11
-
12
-
13
-
14
-
15
-
16
-
17
-
18
-
19
-
20
-
21
-
22
-
23
-
24
-
25
-
26
-
27
-
28
-
29
-
30
-
31
-
32
-
33
-
34
-
35
-
36
-
37
-
38
-
39
-
40
-
41
-
42
-
43
-
44
-
45
-
46
-
47
-
48
-
49
-
50
-
51
-
52
-
53
-
54
-
55
-
56
-
57
-
58
-
59
-
60
-
61
-
62
-
63
-
64
-
65
-
66
-
67
-
68
-
69
-
70
-
71
-
72
-
73
-
74
-
75
-
76
-
77
-
78
-
79
-
80
-
81
-
82
-
83
-
84
-
85
-
86
-
87
-
88
-
89
-
90
-
91
-
92
-
93
-
94
-
95
-
96
-
97
-
98
-
99
-
100
-
101
-
102
-
103
-
104
-
105
-
106
-
107
-
108
-
109
-
110
-
111
-
112
-
113
-
114
-
115
-
116
-
117
-
118
-
119
-
120
-
121
-
122
-
123
-
124
-
125
-
126
-
127
-
128
-
129
-
130
-
131
-
132
-
133
-
134
-
135
-
136
-
137
-
138
-
139
-
140
-
141
-
142
-
143
-
144
-
145
-
146
-
147
-
148
-
149
-
150
-
151
-
152
-
153
-
154
-
155
-
156
-
157
-
158
-
159
-
160
-
161
-
162
-
163
-
164
-
165
-
166
-
167
-
168
-
169
-
170
-
171
-
172
-
173
-
174
-
175
-
176
-
177
-
178
-
179
-
180
-
181
-
182
-
183
-
184
-
185
-
186
-
187
-
188
-
189
-
190
-
191
-
192
-
193
-
194
-
195
-
196
-
197
-
198
-
199
-
200
-
201
-
202
-
203
-
204
-
205
-
206
-
207
-
208
-
209
-
210
-
211
-
212
-
213
-
214
-
215
-
216
-
217
-
218
-
219
-
220
-
221
-
222
-
223
-
224
-
225
-
226
-
227
-
228
-
229
-
230
-
231
-
232
-
233
-
234
-
235
-
236
-
237
-
238
-
239
-
240
-
241
-
242
-
243
-
244
-
245
-
246
-
247
-
248
-
249
-
250
-
251
-
252
-
253
-
254
-
255
-
256
-
257
-
258
-
259
-
260
-
261
-
262
-
263
-
264
-
265
-
266
-
267
-
268
-
269
-
270
-
271
-
272
-
273
-
274
-
275
-
276
-
277
-
278
-
279
-
280
-
281
-
282
-
283
-
284
-
285
-
286
-
287
-
288
-
289
-
290
-
291
-
292
-
293
-
294
-
295
-
296
-
297
-
298
-
299
-
300
-
 301
301 -
 302
302 -
 303
303 -
 304
304 -
 305
305 -
 306
306 -
 307
307 -
 308
308 -
 309
309 -
 310
310 -
 311
311 -
 312
312 -
 313
313 -
 314
314 -
 315
315 -
 316
316 -
 317
317 -
 318
318 -
 319
319 -
 320
320 -
 321
321 -
322
-
323
-
324
-
325
-
326
-
327
-
328
-
329
-
330
-
331
-
332
-
333
-
334
-
335
-
336
-
337
-
338
-
339
-
340
-
341
-
342
-
343
-
344
-
345
-
346
-
347
-
348
-
349
-
350
-
351
-
352
-
353
-
354
-
355
-
356
-
357
-
358
-
359
-
360
-
361
-
362
-
363
-
364
-
365
-
366
-
367
-
368
-
369
-
370
-
371
-
372
-
373
-
374
-
375
-
376
-
377
-
378
-
379
-
380
-
381
-
382
-
383
-
384
-
385
-
386
-
387
-
388
-
389
-
390
-
391
-
392
-
393
-
394
-
395
-
396
-
397
-
398
-
399
-
400
-
401
-
402
-
403
-
404
-
405
-
406
-
407
-
408
-
409
-
410
-
411
-
412
-
413
-
414
-
415
-
416
-
417
-
418
-
419
-
420
-
421
-
422
-
423
-
424
-
425
-
426
-
427
-
428
-
429
-
430
-
431
-
432
-
433
-
434
-
435
-
436
-
437
-
438
-
439
-
440
-
441
-
442
-
443
-
444
-
445
 |
 |

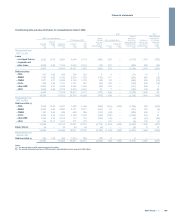
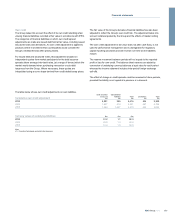
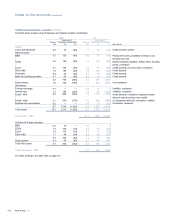
The following table provides information for reclassifications made in 2008.
2008 2007
2008 - on reclassification
31 December 2008 After reclassification
Carrying
value
Effective
interest
rate
Expected
cash flows
Carrying
value
Fair
value
Gains/
(losses)
up to the
date of
reclassification Income
Impairment
losses
Amount
that would
have been
recognised had
reclassification
not occurred
Increase in
profit or loss
as result of
reclassification
Gains/(losses)
recognised in
the income
statement
in prior
period
£m % £m £m £m £m £m £m £m £m £m
Reclassified from
HFT to LAR
Loans
-leveraged finance 3,602 10.14 6,091 4,304 2,714 (456) 455 — (1,015) 1,470 (155)
- corporate and
other loans 5,205 6.03 7,752 6,053 5,143 (74) 267 — (639) 906 (46)
8,807 13,843 10,357 7,857 (530) 722 — (1,654) 2,376 (201)
Debt securities
-CDO 215 4.92 259 236 221 4 5 — (11) 16 5
- RMBS 1,765 6.05 2,136 2,059 1,579 (115) 171 — (293) 464 (12)
- CMBS 1,877 4.77 2,402 2,144 1,776 (42) 50 — (293) 343 (19)
- CLOs 835 6.34 1,141 1,121 851 (22) 104 — (164) 268 (14)
- other ABS 2,203 5.07 3,203 2,242 1,943 (68) 129 — (151) 280 3
- other 2,548 2.64 2,778 2,615 2,401 73 7 — (162) 169 95
9,443 11,919 10,417 8,771 (170) 466 — (1,074) 1,540 58
18,250 25,762 20,774 16,628 (700) 1,188 — (2,728) 3,916 (143)
Reclassified from
HFT to AFS
Debt securities (1)
-CDO 3,592 10.32 5,607 1,346 1,346 (994) (514) (446) (1,468) 508 (400)
- RMBS 5,205 8.03 8,890 5,171 5,171 (531) 21 — (131) 152 (4)
- CMBS 590 6.65 836 256 256 (110) (48) — (408) 360 4
- CLOs 3,498 4.89 4,257 3,759 3,759 (353) (797) — (1,633) 836 36
- other ABS 1,323 5.70 2,013 712 712 (185) (36) — (5) (31) (42)
- other 756 10.17 1,311 777 777 — 131 — (3) 134 (1)
14,964 22,914 12,021 12,021 (2,173) (1,243) (446) (3,648) 1,959 (407)
Equity shares 34 — 32 26 26 (9) — — (9) 9 13
14,998 22,946 12,047 12,047 (2,182) (1,243) (446) (3,657) 1,968 (394)
Reclassified from
AFS to LAR:
Debt securities (2) 694 1.38 760 1,016 956 (12) 6 — 6 — —
33,942 49,468 33,837 29,631 (2,894) (49) (446) (6,379) 5,884 (537)
Notes:
(1) The amount taken to AFS reserves was £(2,193) million.
(2) The amount that would have been in AFS reserves if reclassification had not occurred is £(39) million.
309RBS Group 2010
Financial statements