RBS 2010 Annual Report Download - page 162
Download and view the complete annual report
Please find page 162 of the 2010 RBS annual report below. You can navigate through the pages in the report by either clicking on the pages listed below, or by using the keyword search tool below to find specific information within the annual report.-
 1
1 -
2
-
3
-
4
-
5
-
6
-
7
-
8
-
9
-
10
-
11
-
12
-
13
-
14
-
15
-
16
-
17
-
18
-
19
-
20
-
21
-
22
-
23
-
24
-
25
-
26
-
27
-
28
-
29
-
30
-
31
-
32
-
33
-
34
-
35
-
36
-
37
-
38
-
39
-
40
-
41
-
42
-
43
-
44
-
45
-
46
-
47
-
48
-
49
-
50
-
51
-
52
-
53
-
54
-
55
-
56
-
57
-
58
-
59
-
60
-
61
-
62
-
63
-
64
-
65
-
66
-
67
-
68
-
69
-
70
-
71
-
72
-
73
-
74
-
75
-
76
-
77
-
78
-
79
-
80
-
81
-
82
-
83
-
84
-
85
-
86
-
87
-
88
-
89
-
90
-
91
-
92
-
93
-
94
-
95
-
96
-
97
-
98
-
99
-
100
-
101
-
102
-
103
-
104
-
105
-
106
-
107
-
108
-
109
-
110
-
111
-
112
-
113
-
114
-
115
-
116
-
117
-
118
-
119
-
120
-
121
-
122
-
123
-
124
-
125
-
126
-
127
-
128
-
129
-
130
-
131
-
132
-
133
-
134
-
135
-
136
-
137
-
138
-
139
-
140
-
141
-
142
-
143
-
144
-
145
-
146
-
147
-
148
-
149
-
150
-
151
-
 152
152 -
 153
153 -
 154
154 -
 155
155 -
 156
156 -
 157
157 -
 158
158 -
 159
159 -
 160
160 -
 161
161 -
 162
162 -
 163
163 -
 164
164 -
 165
165 -
 166
166 -
 167
167 -
 168
168 -
 169
169 -
 170
170 -
 171
171 -
 172
172 -
173
-
174
-
175
-
176
-
177
-
178
-
179
-
180
-
181
-
182
-
183
-
184
-
185
-
186
-
187
-
188
-
189
-
190
-
191
-
192
-
193
-
194
-
195
-
196
-
197
-
198
-
199
-
200
-
201
-
202
-
203
-
204
-
205
-
206
-
207
-
208
-
209
-
210
-
211
-
212
-
213
-
214
-
215
-
216
-
217
-
218
-
219
-
220
-
221
-
222
-
223
-
224
-
225
-
226
-
227
-
228
-
229
-
230
-
231
-
232
-
233
-
234
-
235
-
236
-
237
-
238
-
239
-
240
-
241
-
242
-
243
-
244
-
245
-
246
-
247
-
248
-
249
-
250
-
251
-
252
-
253
-
254
-
255
-
256
-
257
-
258
-
259
-
260
-
261
-
262
-
263
-
264
-
265
-
266
-
267
-
268
-
269
-
270
-
271
-
272
-
273
-
274
-
275
-
276
-
277
-
278
-
279
-
280
-
281
-
282
-
283
-
284
-
285
-
286
-
287
-
288
-
289
-
290
-
291
-
292
-
293
-
294
-
295
-
296
-
297
-
298
-
299
-
300
-
301
-
302
-
303
-
304
-
305
-
306
-
307
-
308
-
309
-
310
-
311
-
312
-
313
-
314
-
315
-
316
-
317
-
318
-
319
-
320
-
321
-
322
-
323
-
324
-
325
-
326
-
327
-
328
-
329
-
330
-
331
-
332
-
333
-
334
-
335
-
336
-
337
-
338
-
339
-
340
-
341
-
342
-
343
-
344
-
345
-
346
-
347
-
348
-
349
-
350
-
351
-
352
-
353
-
354
-
355
-
356
-
357
-
358
-
359
-
360
-
361
-
362
-
363
-
364
-
365
-
366
-
367
-
368
-
369
-
370
-
371
-
372
-
373
-
374
-
375
-
376
-
377
-
378
-
379
-
380
-
381
-
382
-
383
-
384
-
385
-
386
-
387
-
388
-
389
-
390
-
391
-
392
-
393
-
394
-
395
-
396
-
397
-
398
-
399
-
400
-
401
-
402
-
403
-
404
-
405
-
406
-
407
-
408
-
409
-
410
-
411
-
412
-
413
-
414
-
415
-
416
-
417
-
418
-
419
-
420
-
421
-
422
-
423
-
424
-
425
-
426
-
427
-
428
-
429
-
430
-
431
-
432
-
433
-
434
-
435
-
436
-
437
-
438
-
439
-
440
-
441
-
442
-
443
-
444
-
445
 |
 |

Risk management: Credit risk continued
Credit risk assets* continued
Key credit portfolios continued
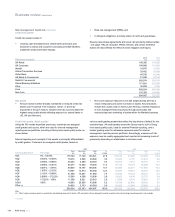
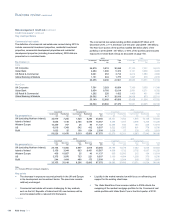
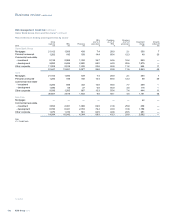
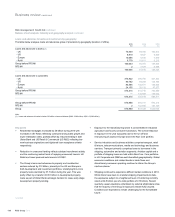
Retail credit assets: Personal lending
The Group's personal lending portfolio includes credit cards, unsecured loans, auto finance and overdrafts. The majority of personal lending exposures
exist in the UK and the US. New defaults as a proportion of average loans and receivables are shown in the following table.
2010 2009 2008
Personal lending
Average
loans and
receivables
£m
Impairment
charge
as a % o
f
loans and
receivables
%
Average
loans and
receivables
£m
Impairment
charge
as a % o
f
loans and
receivables
%
Average
loans and
receivables
£m
Impairment
charge
as a % o
f
loans and
receivables
%
UK Retail cards (1) 6,025 5.0 6,101 8.7 6,617 6.4
UK Retail loans (1) 9,863 4.8 12,062 5.9 13,545 3.3
$m % $m % $m %
Citizens cards (2,3) 1,555 9.9 1,772 9.7 2,275 4.9
Citizens auto loans (2) 8,133 0.6 9,759 1.2 11,386 1.1
Notes:
(1) The ratio for UK Retail assets refers to the impairment charges for the year.
(2) The ratio for Citizens refers to charge-offs in the year, net of recoveries realised in the year.
(3) The 2009 data have been revised to exclude the Kroger Personal Finance portfolio, which was sold in 2010.
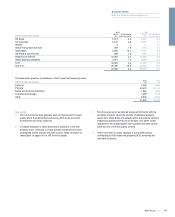
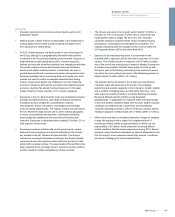
Key points
xThe UK personal lending portfolio, of which 98% is in Core
businesses, comprises credit cards, unsecured loans and overdrafts
and totalled £18.1 billion at 31 December 2010 (2009 - £20.3 billion),
adecrease of 11% due to continued subdued loan recruitment
activity and a continuing general market trend of customers repaying
unsecured loan balances with cards and current account balances
remaining stable. The Non-Core portfolio consists of the direct
finance loan portfolios (Direct Line, Lombard, Mint and Churchill),
and totalled £0.45 billion at 31 December 2010 (2009 - £0.7 billion).
xRisk appetite continues to be actively managed across all products.
Support continues for customers experiencing financial difficulties
through “breathing space initiatives” on all unsecured products,
whereby a thirty day period is given to allow customers to establish
a debt repayment plan. During this time the Group suspends
collection activity. A further extension of thirty days can be granted if
progress is made and discussions are continuing. Investment in
collection and recovery processes continues, addressing both
continued support for the Group’s customers and the management
of impairments.
xBenefiting from a combination of risk appetite tightening and a more
favourable economic environment, impairment losses on unsecured
lending have reduced significantly during 2010 from £1,603 million
at 31 December 2009 to £991 million at 31 December 2010 with the
downward trajectory moderating significantly in the latter part of the
year. Impairments will remain sensitive to the external environment.
xIndustry benchmarks for cards arrears remain stable, with the Group
continuing to perform favourably.
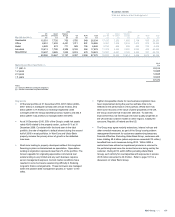
xOutstanding balances for the Citizens credit card portfolio totalled
$1.53 billion at 31 December 2010. This figure excludes the Kroger
Personal Finance portfolio, which was sold on 27 May 2010. Core
assets comprised 86.3% of the portfolio.
xThe Citizens cards business has traditionally adopted conservative
risk strategies compared to the US market as a whole. Given the
economic climate, Citizens has over the past 24 months introduced
tighter lending criteria and lower credit limits. These actions have led
to improving new business quality and a business performing on par
with industry benchmarks (provided by VISA). The latest available
metrics show the rate for 60+ days delinquency as a percentage of
total outstanding balances at 3.17% in December 2010 (compared
to an industry figure of 3.22%) and net contractual charge-offs as a
percentage of total outstanding balances at 4.76% in December
2010 (compared to an industry figure of 5.67%). We expect further
improvement based on early delinquency trends.
xCitizens is a leading regional provider of retail auto financing to US
consumers through a network of 3,433 auto dealers located in 23
US states. Citizens maintain a conservative, prime indirect auto
lending credit programme with loss rates that have historically been
below national averages. Current outstanding retail auto loan
balances totalled $7.9 billion (includes Core and Non-Core) at 31
December 2010 of which 96% of the portfolio is in the Core business.
The $324 million of Non-Core auto assets are anticipated to run-off
by 2013. The tightening of credit parameters in 2008-09, along with
enhanced collection activities and seasonal factors, has resulted in
improved credit performance. The net charge-off rate on the total
auto portfolio fell to 0.34% at 31 December 2010, down from 1.3% at
31 December 2009. The 30+ DPD delinquency rate fell from 2.6%
as of 31 December 2009 to 1.6% at 31 December 2010 even as
balances fell by $917 million. The 1.7% 30+ DPD delinquency rate
on the total auto loan portfolio at 30 September 2010 Citizens was
favourable to the 2.6% nationwide bank indirect auto delinquency
rate as reported by Experian.
*unaudited
RBS Group 2010160
Business review continued