RBS 2010 Annual Report Download - page 298
Download and view the complete annual report
Please find page 298 of the 2010 RBS annual report below. You can navigate through the pages in the report by either clicking on the pages listed below, or by using the keyword search tool below to find specific information within the annual report.-
 1
1 -
2
-
3
-
4
-
5
-
6
-
7
-
8
-
9
-
10
-
11
-
12
-
13
-
14
-
15
-
16
-
17
-
18
-
19
-
20
-
21
-
22
-
23
-
24
-
25
-
26
-
27
-
28
-
29
-
30
-
31
-
32
-
33
-
34
-
35
-
36
-
37
-
38
-
39
-
40
-
41
-
42
-
43
-
44
-
45
-
46
-
47
-
48
-
49
-
50
-
51
-
52
-
53
-
54
-
55
-
56
-
57
-
58
-
59
-
60
-
61
-
62
-
63
-
64
-
65
-
66
-
67
-
68
-
69
-
70
-
71
-
72
-
73
-
74
-
75
-
76
-
77
-
78
-
79
-
80
-
81
-
82
-
83
-
84
-
85
-
86
-
87
-
88
-
89
-
90
-
91
-
92
-
93
-
94
-
95
-
96
-
97
-
98
-
99
-
100
-
101
-
102
-
103
-
104
-
105
-
106
-
107
-
108
-
109
-
110
-
111
-
112
-
113
-
114
-
115
-
116
-
117
-
118
-
119
-
120
-
121
-
122
-
123
-
124
-
125
-
126
-
127
-
128
-
129
-
130
-
131
-
132
-
133
-
134
-
135
-
136
-
137
-
138
-
139
-
140
-
141
-
142
-
143
-
144
-
145
-
146
-
147
-
148
-
149
-
150
-
151
-
152
-
153
-
154
-
155
-
156
-
157
-
158
-
159
-
160
-
161
-
162
-
163
-
164
-
165
-
166
-
167
-
168
-
169
-
170
-
171
-
172
-
173
-
174
-
175
-
176
-
177
-
178
-
179
-
180
-
181
-
182
-
183
-
184
-
185
-
186
-
187
-
188
-
189
-
190
-
191
-
192
-
193
-
194
-
195
-
196
-
197
-
198
-
199
-
200
-
201
-
202
-
203
-
204
-
205
-
206
-
207
-
208
-
209
-
210
-
211
-
212
-
213
-
214
-
215
-
216
-
217
-
218
-
219
-
220
-
221
-
222
-
223
-
224
-
225
-
226
-
227
-
228
-
229
-
230
-
231
-
232
-
233
-
234
-
235
-
236
-
237
-
238
-
239
-
240
-
241
-
242
-
243
-
244
-
245
-
246
-
247
-
248
-
249
-
250
-
251
-
252
-
253
-
254
-
255
-
256
-
257
-
258
-
259
-
260
-
261
-
262
-
263
-
264
-
265
-
266
-
267
-
268
-
269
-
270
-
271
-
272
-
273
-
274
-
275
-
276
-
277
-
278
-
279
-
280
-
281
-
282
-
283
-
284
-
285
-
286
-
287
-
 288
288 -
 289
289 -
 290
290 -
 291
291 -
 292
292 -
 293
293 -
 294
294 -
 295
295 -
 296
296 -
 297
297 -
 298
298 -
 299
299 -
 300
300 -
 301
301 -
 302
302 -
 303
303 -
 304
304 -
 305
305 -
 306
306 -
 307
307 -
 308
308 -
309
-
310
-
311
-
312
-
313
-
314
-
315
-
316
-
317
-
318
-
319
-
320
-
321
-
322
-
323
-
324
-
325
-
326
-
327
-
328
-
329
-
330
-
331
-
332
-
333
-
334
-
335
-
336
-
337
-
338
-
339
-
340
-
341
-
342
-
343
-
344
-
345
-
346
-
347
-
348
-
349
-
350
-
351
-
352
-
353
-
354
-
355
-
356
-
357
-
358
-
359
-
360
-
361
-
362
-
363
-
364
-
365
-
366
-
367
-
368
-
369
-
370
-
371
-
372
-
373
-
374
-
375
-
376
-
377
-
378
-
379
-
380
-
381
-
382
-
383
-
384
-
385
-
386
-
387
-
388
-
389
-
390
-
391
-
392
-
393
-
394
-
395
-
396
-
397
-
398
-
399
-
400
-
401
-
402
-
403
-
404
-
405
-
406
-
407
-
408
-
409
-
410
-
411
-
412
-
413
-
414
-
415
-
416
-
417
-
418
-
419
-
420
-
421
-
422
-
423
-
424
-
425
-
426
-
427
-
428
-
429
-
430
-
431
-
432
-
433
-
434
-
435
-
436
-
437
-
438
-
439
-
440
-
441
-
442
-
443
-
444
-
445
 |
 |

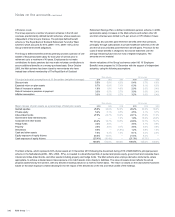
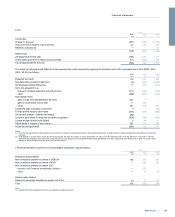
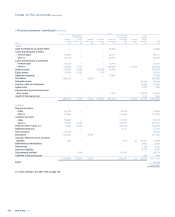
4 Pension costs continued
The table below sets out the sensitivities of the pension cost for the year and the present value of defined benefit obligations at 31 December to a
change in the principal actuarial assumptions:
Main scheme All schemes
Increase/(decrease) Increase/(decrease)
in pension cost
for year
in obligation
at 31 December
in pension cost
for year
in obligation
at 31 December
2010 2009 2008 2010 2009 2008 2010 2009 2008 2010 2009 2008
£m £m £m £m £m £m £m £m £m £m £m £m
0.25% increase in the discount rate (17) (21) (37) (925) (790) (696) (42) (41) (53) (1,245) (1,261) (1,161)
0.25% increase in inflation 59 49 77 799 654 624 89 93 114 1,106 1,143 1,089
0.25% additional rate of increase in
pensions in payment 37 33 41 527 442 383 43 47 63 599 596 695
0.25% additional rate of increase in
deferred pensions 21 16 8 265 214 94 44 25 15 497 366 227
0.25% additional rate of increase in
salaries 68 28 56 66 168 30 17 35 270 125 219
Longevity increase of 1 year 34 29 31 519 416 302 59 50 50 781 734 700
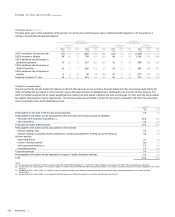
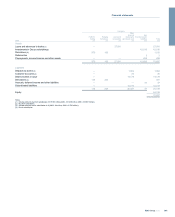
5Auditor’s remuneration
Amounts paid to the Group's auditors for statutory audit and other services are set out below. All audit related and other services are approved by the
Audit Committee and are subject to strict controls to ensure the external auditor’s independence is unaffected by the provision of other services. The
Audit Committee recognise that for certain assignments the auditors are best placed to perform the work economically; for other work the Group selects
the supplier best placed to meet its requirements. The Group’s auditors are permitted to tender for such work in competition with other firms where the
work is permissible under audit independence rules.
Group
2010 2009
£m £m
Fees payable for the audit of the Group's annual accounts 4.0 4.4
Fees payable to the auditor and its associates for other services to the Group pursuant to legislation
- the audit of the company's subsidiaries (1) 26.0 36.9
- other services (2) 3.2 3.3
Total audit and audit related services 33.2 44.6
Fees payable to the auditor and its associates for other services
- services relating to tax 0.5 1.4
- services relating to corporate finance transactions, including securitisations, entered into by the Group (3) 0.8 2.5
All other services
- accounting advice 0.1 0.6
- review of internal controls 0.9 1.1
- other assurance services (4) 5.7 2.4
- consulting services 1.8 0.9
Total other services 9.8 8.9
Fees payable to the auditor and its associates in respect of audits of pension schemes 0.2 0.4
Total 43.2 53.9
Notes:
(1) The prior year fees include £21.9 million in respect of the audit of ABN AMRO Holdings N.V., of which £8.8 million related to the interests of the State of the Netherlands and Santander.
(2) Includes fees of £1.2 million (2009 - £1.7 million) in relation to reviews of interim financial information and £2.0 million (2009 - £1.6 million) in respect of reports to the Group's regulators in the UK and
overseas.
(3) Includes fees of £0.5 million (2009 - £2.1 million) in respect of work performed by the auditors as reporting accountants on debt and equity issuances undertaken by the Group, including
securitisations.
(4) Includes fees of £2.9 million (2009 - nil) in respect of audit and assurance of financial information in connection with disposals by the Group.
RBS Group 2010296
Notes on the accounts continued