RBS 2010 Annual Report Download - page 297
Download and view the complete annual report
Please find page 297 of the 2010 RBS annual report below. You can navigate through the pages in the report by either clicking on the pages listed below, or by using the keyword search tool below to find specific information within the annual report.-
 1
1 -
2
-
3
-
4
-
5
-
6
-
7
-
8
-
9
-
10
-
11
-
12
-
13
-
14
-
15
-
16
-
17
-
18
-
19
-
20
-
21
-
22
-
23
-
24
-
25
-
26
-
27
-
28
-
29
-
30
-
31
-
32
-
33
-
34
-
35
-
36
-
37
-
38
-
39
-
40
-
41
-
42
-
43
-
44
-
45
-
46
-
47
-
48
-
49
-
50
-
51
-
52
-
53
-
54
-
55
-
56
-
57
-
58
-
59
-
60
-
61
-
62
-
63
-
64
-
65
-
66
-
67
-
68
-
69
-
70
-
71
-
72
-
73
-
74
-
75
-
76
-
77
-
78
-
79
-
80
-
81
-
82
-
83
-
84
-
85
-
86
-
87
-
88
-
89
-
90
-
91
-
92
-
93
-
94
-
95
-
96
-
97
-
98
-
99
-
100
-
101
-
102
-
103
-
104
-
105
-
106
-
107
-
108
-
109
-
110
-
111
-
112
-
113
-
114
-
115
-
116
-
117
-
118
-
119
-
120
-
121
-
122
-
123
-
124
-
125
-
126
-
127
-
128
-
129
-
130
-
131
-
132
-
133
-
134
-
135
-
136
-
137
-
138
-
139
-
140
-
141
-
142
-
143
-
144
-
145
-
146
-
147
-
148
-
149
-
150
-
151
-
152
-
153
-
154
-
155
-
156
-
157
-
158
-
159
-
160
-
161
-
162
-
163
-
164
-
165
-
166
-
167
-
168
-
169
-
170
-
171
-
172
-
173
-
174
-
175
-
176
-
177
-
178
-
179
-
180
-
181
-
182
-
183
-
184
-
185
-
186
-
187
-
188
-
189
-
190
-
191
-
192
-
193
-
194
-
195
-
196
-
197
-
198
-
199
-
200
-
201
-
202
-
203
-
204
-
205
-
206
-
207
-
208
-
209
-
210
-
211
-
212
-
213
-
214
-
215
-
216
-
217
-
218
-
219
-
220
-
221
-
222
-
223
-
224
-
225
-
226
-
227
-
228
-
229
-
230
-
231
-
232
-
233
-
234
-
235
-
236
-
237
-
238
-
239
-
240
-
241
-
242
-
243
-
244
-
245
-
246
-
247
-
248
-
249
-
250
-
251
-
252
-
253
-
254
-
255
-
256
-
257
-
258
-
259
-
260
-
261
-
262
-
263
-
264
-
265
-
266
-
267
-
268
-
269
-
270
-
271
-
272
-
273
-
274
-
275
-
276
-
277
-
278
-
279
-
280
-
281
-
282
-
283
-
284
-
285
-
286
-
 287
287 -
 288
288 -
 289
289 -
 290
290 -
 291
291 -
 292
292 -
 293
293 -
 294
294 -
 295
295 -
 296
296 -
 297
297 -
 298
298 -
 299
299 -
 300
300 -
 301
301 -
 302
302 -
 303
303 -
 304
304 -
 305
305 -
 306
306 -
 307
307 -
308
-
309
-
310
-
311
-
312
-
313
-
314
-
315
-
316
-
317
-
318
-
319
-
320
-
321
-
322
-
323
-
324
-
325
-
326
-
327
-
328
-
329
-
330
-
331
-
332
-
333
-
334
-
335
-
336
-
337
-
338
-
339
-
340
-
341
-
342
-
343
-
344
-
345
-
346
-
347
-
348
-
349
-
350
-
351
-
352
-
353
-
354
-
355
-
356
-
357
-
358
-
359
-
360
-
361
-
362
-
363
-
364
-
365
-
366
-
367
-
368
-
369
-
370
-
371
-
372
-
373
-
374
-
375
-
376
-
377
-
378
-
379
-
380
-
381
-
382
-
383
-
384
-
385
-
386
-
387
-
388
-
389
-
390
-
391
-
392
-
393
-
394
-
395
-
396
-
397
-
398
-
399
-
400
-
401
-
402
-
403
-
404
-
405
-
406
-
407
-
408
-
409
-
410
-
411
-
412
-
413
-
414
-
415
-
416
-
417
-
418
-
419
-
420
-
421
-
422
-
423
-
424
-
425
-
426
-
427
-
428
-
429
-
430
-
431
-
432
-
433
-
434
-
435
-
436
-
437
-
438
-
439
-
440
-
441
-
442
-
443
-
444
-
445
 |
 |

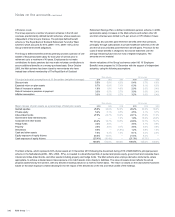
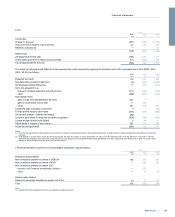
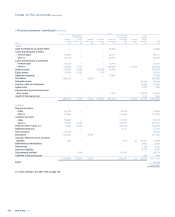
The pension charge/(credit) to the income statement comprises:
2010
£m
2009
£m
2008
£m
Continuing operations 441 (1,510) 473
Discontinued operations 21 21 17
462 (1,489) 490
Curtailment gains of £78 million have been recognised in 2010 arising
from changes to pension benefits in a subsidiary’s scheme. Curtailment
gains of £2,148 million were recognised in 2009 arising from changes to
pension benefits in the Main scheme and certain other subsidiaries’
schemes due to the capping of future salary increases that will count for
pension purposes to the lower of 2% or the rate of CPI inflation in any
year. The curtailment gains in 2009 were separately disclosed on the
face of the income statement due to their size.
Following the legal separation of ABN AMRO Bank N.V. on 1 April 2010,
ABN AMRO’s principal pension scheme in the Netherlands was
transferred to the State of the Netherlands. At 31 December 2009, this
scheme had fair value of plan assets of £8,118 million (2008 - £8,181
million) and present value of defined benefit obligations of £8,298 million
(2008 - £8,589 million). The principal actuarial assumptions at 31
December 2009 were: discount rate 5.25% (2008 - 5.4%); expected
return on plan assets (weighted average) 5.25% (2008 - 5.25%); rate of
increase in salaries 2.5% (2008 - 2.5%); rate of increase in pensions in
payment 2.0% (2008 - 2.0%); and inflation assumption 2.0% (2008 -
2.0%).
The Group expects to contribute £500 million to its defined benefit
pension schemes in 2011 (Main scheme - £333 million). Of the net
liabilities of schemes in deficit, £161 million (2009 - £198 million; 2008 -
£201 million) relates to unfunded schemes.
The most recent funding valuation of the Main UK scheme was 31 March
2007. A funding valuation of the Main UK scheme at 31 March 2010 is
currently in progress. The scheme trustees and the Group are in
discussion on this valuation and the level of contributions to be paid by
the Group and expect to reach agreement by 30 June 2011. The Group
expects that in addition to estimated contributions of £300 - £350 million
for future accrual of benefits, it will make additional contributions, as yet
unquantified, in 2011 and subsequent years to improve the funding
position of the scheme.
Cumulative net actuarial losses of £4,224 million (2009 - £4,382 million
losses; 2008 - £717 million gains) have been recognised in the statement
of comprehensive income, of which £3,252 million losses (2009 - £3,296
million losses; 2008 - £184 million gains) relate to the Main scheme.
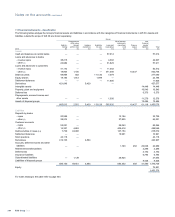
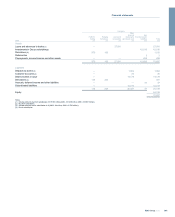
Main scheme All schemes
History of defined benefit schemes 2010
£m
2009
£m
2008
£m
2007
£m
2006
£m
2010
£m
2009
£m
2008
£m
2007
£m
2006
£m
Fair value of plan assets 19,110 16,603 14,804 18,575 17,374 22,816 27,925 25,756 27,662 18,959
Present value of defined benefit
obligations 21,092 18,675 15,594 18,099 19,004 24,999 30,830 27,752 27,547 20,951
Net deficit/(surplus) 1,982 2,072 790 (476) 1,630 2,183 2,905 1,996 (115) 1,992
Experience (losses)/gains on plan
liabilities (858) 135 (55) (256) (4) (882) 328 (65) (210) (19)
Experience gains/(losses) on plan
assets 1,718 993 (4,784) 163 552 1,797 1,344 (6,051) 19 587
Actual return/(loss) on pension
schemes assets 2,832 2,022 (3,513) 1,345 1,574 3,225 2,897 (4,186) 1,413 1,660
Actual return/(loss) on pension
schemes assets - % 17.2% 13.8% (19.0%) 7.8% 9.9% 15.6% 11.4% (14.5%) 6.9% 9.6%
295RBS Group 2010
Financial statements