RBS 2010 Annual Report Download - page 66
Download and view the complete annual report
Please find page 66 of the 2010 RBS annual report below. You can navigate through the pages in the report by either clicking on the pages listed below, or by using the keyword search tool below to find specific information within the annual report.-
 1
1 -
2
-
3
-
4
-
5
-
6
-
7
-
8
-
9
-
10
-
11
-
12
-
13
-
14
-
15
-
16
-
17
-
18
-
19
-
20
-
21
-
22
-
23
-
24
-
25
-
26
-
27
-
28
-
29
-
30
-
31
-
32
-
33
-
34
-
35
-
36
-
37
-
38
-
39
-
40
-
41
-
42
-
43
-
44
-
45
-
46
-
47
-
48
-
49
-
50
-
51
-
52
-
53
-
54
-
55
-
 56
56 -
 57
57 -
 58
58 -
 59
59 -
 60
60 -
 61
61 -
 62
62 -
 63
63 -
 64
64 -
 65
65 -
 66
66 -
 67
67 -
 68
68 -
 69
69 -
 70
70 -
 71
71 -
 72
72 -
 73
73 -
 74
74 -
 75
75 -
 76
76 -
77
-
78
-
79
-
80
-
81
-
82
-
83
-
84
-
85
-
86
-
87
-
88
-
89
-
90
-
91
-
92
-
93
-
94
-
95
-
96
-
97
-
98
-
99
-
100
-
101
-
102
-
103
-
104
-
105
-
106
-
107
-
108
-
109
-
110
-
111
-
112
-
113
-
114
-
115
-
116
-
117
-
118
-
119
-
120
-
121
-
122
-
123
-
124
-
125
-
126
-
127
-
128
-
129
-
130
-
131
-
132
-
133
-
134
-
135
-
136
-
137
-
138
-
139
-
140
-
141
-
142
-
143
-
144
-
145
-
146
-
147
-
148
-
149
-
150
-
151
-
152
-
153
-
154
-
155
-
156
-
157
-
158
-
159
-
160
-
161
-
162
-
163
-
164
-
165
-
166
-
167
-
168
-
169
-
170
-
171
-
172
-
173
-
174
-
175
-
176
-
177
-
178
-
179
-
180
-
181
-
182
-
183
-
184
-
185
-
186
-
187
-
188
-
189
-
190
-
191
-
192
-
193
-
194
-
195
-
196
-
197
-
198
-
199
-
200
-
201
-
202
-
203
-
204
-
205
-
206
-
207
-
208
-
209
-
210
-
211
-
212
-
213
-
214
-
215
-
216
-
217
-
218
-
219
-
220
-
221
-
222
-
223
-
224
-
225
-
226
-
227
-
228
-
229
-
230
-
231
-
232
-
233
-
234
-
235
-
236
-
237
-
238
-
239
-
240
-
241
-
242
-
243
-
244
-
245
-
246
-
247
-
248
-
249
-
250
-
251
-
252
-
253
-
254
-
255
-
256
-
257
-
258
-
259
-
260
-
261
-
262
-
263
-
264
-
265
-
266
-
267
-
268
-
269
-
270
-
271
-
272
-
273
-
274
-
275
-
276
-
277
-
278
-
279
-
280
-
281
-
282
-
283
-
284
-
285
-
286
-
287
-
288
-
289
-
290
-
291
-
292
-
293
-
294
-
295
-
296
-
297
-
298
-
299
-
300
-
301
-
302
-
303
-
304
-
305
-
306
-
307
-
308
-
309
-
310
-
311
-
312
-
313
-
314
-
315
-
316
-
317
-
318
-
319
-
320
-
321
-
322
-
323
-
324
-
325
-
326
-
327
-
328
-
329
-
330
-
331
-
332
-
333
-
334
-
335
-
336
-
337
-
338
-
339
-
340
-
341
-
342
-
343
-
344
-
345
-
346
-
347
-
348
-
349
-
350
-
351
-
352
-
353
-
354
-
355
-
356
-
357
-
358
-
359
-
360
-
361
-
362
-
363
-
364
-
365
-
366
-
367
-
368
-
369
-
370
-
371
-
372
-
373
-
374
-
375
-
376
-
377
-
378
-
379
-
380
-
381
-
382
-
383
-
384
-
385
-
386
-
387
-
388
-
389
-
390
-
391
-
392
-
393
-
394
-
395
-
396
-
397
-
398
-
399
-
400
-
401
-
402
-
403
-
404
-
405
-
406
-
407
-
408
-
409
-
410
-
411
-
412
-
413
-
414
-
415
-
416
-
417
-
418
-
419
-
420
-
421
-
422
-
423
-
424
-
425
-
426
-
427
-
428
-
429
-
430
-
431
-
432
-
433
-
434
-
435
-
436
-
437
-
438
-
439
-
440
-
441
-
442
-
443
-
444
-
445
 |
 |

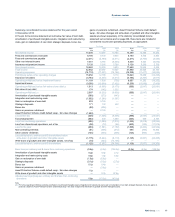
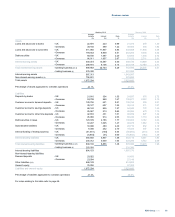
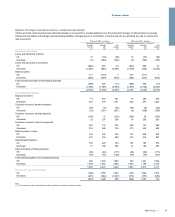
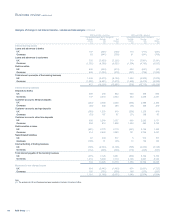
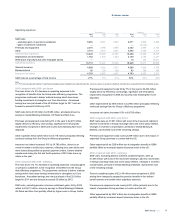
Average balance sheet and related interest continued
Pro forma 2008
Average
balance Interest Rate
£m £m %
Assets
Loans and advances to banks - UK 19,049 978 5.13
- Overseas 28,474 1,311 4.60
Loans and advances to customers - UK 321,177 19,085 5.94
- Overseas 275,000 16,030 5.83
Debt securities - UK 36,395 1,679 4.61
- Overseas 57,998 3,114 5.37
Interest-earning assets -UK 376,621 21,742 5.77
- Overseas 361,472 20,455 5.66
Total interest-earning assets - banking business (2,3,5) 738,093 42,197 5.72
-trading business (4) 425,454
Interest-earning assets 1,163,547
Non-interest-earning assets (2,3) 660,628
Total assets 1,824,175
Percentage of assets applicable to overseas operations 42.5%
Liabilities
Deposits by banks - UK 45,123 1,507 3.34
- Overseas 109,705 4,630 4.22
Customer accounts: demand deposits - UK 99,840 2,794 2.80
- Overseas 36,108 672 1.86
Customer accounts: savings deposits - UK 42,870 1,691 3.94
- Overseas 23,753 570 2.40
Customer accounts: other time deposits - UK 95,181 3,964 4.16
- Overseas 88,570 3,426 3.87
Debt securities in issue - UK 114,234 5,281 4.62
- Overseas 106,207 4,734 4.46
Subordinated liabilities - UK 26,799 1,369 5.11
- Overseas 8,068 413 5.12
Internal funding of trading business - UK (85,664) (3,445) 4.02
- Overseas (18,090) (729) 4.03
Interest-bearing liabilities -UK 338,383 13,161 3.89
- Overseas 354,321 13,716 3.87
Total interest-bearing liabilities - banking business (2,3,6) 692,704 26,877 3.88
-trading business (4) 466,610
Interest-bearing liabilities 1,159,314
Non-interest-bearing liabilities:
Demand deposits - UK 19,262
- Overseas 14,759
Other liabilities (3,4) 572,296
Owners' equity 58,544
Total liabilities and owners' equity 1,824,175
Percentage of liabilities applicable to overseas operations 43.1%
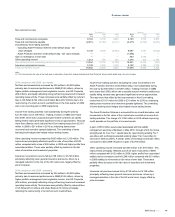
Notes:
(1) The analysis into UK and Overseas has been compiled on the basis of location of office.
(2) Interest-earning assets and interest-bearing liabilities exclude the Retail bancassurance long-term assets and liabilities attributable to policyholders, in view of their distinct nature. As a result, net
interest receivable has been increased by £6 million (2009 - £20 million; 2008 - £84 million).
(3) Interest receivable has been increased by £11 million (2009 - £46 million; 2008 - £332 million) and interest payable has been decreased by £30 million (2009 - £350 million increase; 2008 - £860
million increase) to record interest on financial assets and liabilities designated as at fair value through profit or loss. Related interest-earning assets and interest-bearing liabilities have also been
adjusted.
(4) Interest receivable and interest payable on trading assets and liabilities are included in income from trading activities.
(5) Interest receivable has been decreased by £90 million in respect of a non-recurring receivable (2009 - nil; 2008 - nil).
(6) Interest payable has been increased by £319 million in respect of non-recurring adjustments (2009 - nil; 2008 - nil).
RBS Group 201064
Business review continued