RBS 2010 Annual Report Download - page 295
Download and view the complete annual report
Please find page 295 of the 2010 RBS annual report below. You can navigate through the pages in the report by either clicking on the pages listed below, or by using the keyword search tool below to find specific information within the annual report.-
 1
1 -
2
-
3
-
4
-
5
-
6
-
7
-
8
-
9
-
10
-
11
-
12
-
13
-
14
-
15
-
16
-
17
-
18
-
19
-
20
-
21
-
22
-
23
-
24
-
25
-
26
-
27
-
28
-
29
-
30
-
31
-
32
-
33
-
34
-
35
-
36
-
37
-
38
-
39
-
40
-
41
-
42
-
43
-
44
-
45
-
46
-
47
-
48
-
49
-
50
-
51
-
52
-
53
-
54
-
55
-
56
-
57
-
58
-
59
-
60
-
61
-
62
-
63
-
64
-
65
-
66
-
67
-
68
-
69
-
70
-
71
-
72
-
73
-
74
-
75
-
76
-
77
-
78
-
79
-
80
-
81
-
82
-
83
-
84
-
85
-
86
-
87
-
88
-
89
-
90
-
91
-
92
-
93
-
94
-
95
-
96
-
97
-
98
-
99
-
100
-
101
-
102
-
103
-
104
-
105
-
106
-
107
-
108
-
109
-
110
-
111
-
112
-
113
-
114
-
115
-
116
-
117
-
118
-
119
-
120
-
121
-
122
-
123
-
124
-
125
-
126
-
127
-
128
-
129
-
130
-
131
-
132
-
133
-
134
-
135
-
136
-
137
-
138
-
139
-
140
-
141
-
142
-
143
-
144
-
145
-
146
-
147
-
148
-
149
-
150
-
151
-
152
-
153
-
154
-
155
-
156
-
157
-
158
-
159
-
160
-
161
-
162
-
163
-
164
-
165
-
166
-
167
-
168
-
169
-
170
-
171
-
172
-
173
-
174
-
175
-
176
-
177
-
178
-
179
-
180
-
181
-
182
-
183
-
184
-
185
-
186
-
187
-
188
-
189
-
190
-
191
-
192
-
193
-
194
-
195
-
196
-
197
-
198
-
199
-
200
-
201
-
202
-
203
-
204
-
205
-
206
-
207
-
208
-
209
-
210
-
211
-
212
-
213
-
214
-
215
-
216
-
217
-
218
-
219
-
220
-
221
-
222
-
223
-
224
-
225
-
226
-
227
-
228
-
229
-
230
-
231
-
232
-
233
-
234
-
235
-
236
-
237
-
238
-
239
-
240
-
241
-
242
-
243
-
244
-
245
-
246
-
247
-
248
-
249
-
250
-
251
-
252
-
253
-
254
-
255
-
256
-
257
-
258
-
259
-
260
-
261
-
262
-
263
-
264
-
265
-
266
-
267
-
268
-
269
-
270
-
271
-
272
-
273
-
274
-
275
-
276
-
277
-
278
-
279
-
280
-
281
-
282
-
283
-
284
-
 285
285 -
 286
286 -
 287
287 -
 288
288 -
 289
289 -
 290
290 -
 291
291 -
 292
292 -
 293
293 -
 294
294 -
 295
295 -
 296
296 -
 297
297 -
 298
298 -
 299
299 -
 300
300 -
 301
301 -
 302
302 -
 303
303 -
 304
304 -
 305
305 -
306
-
307
-
308
-
309
-
310
-
311
-
312
-
313
-
314
-
315
-
316
-
317
-
318
-
319
-
320
-
321
-
322
-
323
-
324
-
325
-
326
-
327
-
328
-
329
-
330
-
331
-
332
-
333
-
334
-
335
-
336
-
337
-
338
-
339
-
340
-
341
-
342
-
343
-
344
-
345
-
346
-
347
-
348
-
349
-
350
-
351
-
352
-
353
-
354
-
355
-
356
-
357
-
358
-
359
-
360
-
361
-
362
-
363
-
364
-
365
-
366
-
367
-
368
-
369
-
370
-
371
-
372
-
373
-
374
-
375
-
376
-
377
-
378
-
379
-
380
-
381
-
382
-
383
-
384
-
385
-
386
-
387
-
388
-
389
-
390
-
391
-
392
-
393
-
394
-
395
-
396
-
397
-
398
-
399
-
400
-
401
-
402
-
403
-
404
-
405
-
406
-
407
-
408
-
409
-
410
-
411
-
412
-
413
-
414
-
415
-
416
-
417
-
418
-
419
-
420
-
421
-
422
-
423
-
424
-
425
-
426
-
427
-
428
-
429
-
430
-
431
-
432
-
433
-
434
-
435
-
436
-
437
-
438
-
439
-
440
-
441
-
442
-
443
-
444
-
445
 |
 |

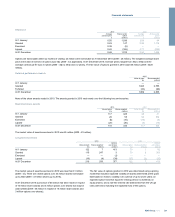
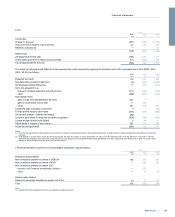
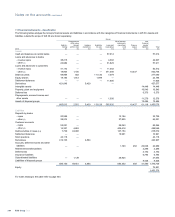
The Main scheme’s holdings of derivative instruments are summarised in the table below:
2010 2009 2008
Fair value Fair value Fair value
Notional
amounts Assets Liabilities
Notional
amounts Assets Liabilities
Notional
amounts Assets Liabilities
£m £m £m £m £m £m £m £m £m
Inflation rate swaps 2,132 69 8
1,171 75 3 947 1 43
Interest rate swaps 10,727 270 110
4,893 46 114 868 18 —
Total return swaps 466 16 —
——— ———
Currency swaps (973) — 1
——— ———
Equity futures 4,851 49 14
1,730 37 — 15 — —
Currency forwards 4,883 35 91
2,908 58 70 1,966 21 267
The investment strategy of other schemes is similar to that of the Main
scheme, adjusted to take account of the nature of liabilities, risk appetite
of the trustees, size of the scheme and any local regulatory constraints.
The use of derivative instruments outside of the Main scheme is not
material.
Swaps are part of the management of the inflation and interest rate
sensitivity of the Main scheme liabilities. They have been executed at
prevailing market rates and within standard market bid/offer spreads.
Substantially all swaps are with The Royal Bank of Scotland plc and
National Westminster Bank Plc (the “banks”). At 31 December 2010, the
gross notional value of the swaps was £12,352 million (2009 - £6,064
million; 2008 - £1,815 million) and had a net positive fair value of
£236 million (2009 - £4 million positive; 2008 - £24 million negative) to the
scheme.
Collateral is required on all swap transactions with those between the
banks and the Main scheme on terms that do not allow the banks to re-
hypothecate. The banks had delivered £210 million of collateral at 31
December 2010 (2009 - held £6 million; 2008 - held £36 million).
Ordinary shares of the company with a fair value of £9 million (2009 - £4
million; 2008 - £15 million) are held by the Group's Main scheme which
also holds other financial instruments issued by the Group with a value of
£264 million (2009 - £192 million; 2008 - £421 million).
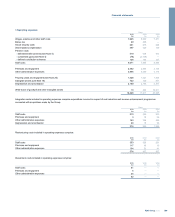
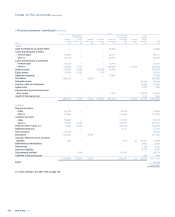
The expected return on plan assets at 31 December is based upon the weighted average of the following assumed returns on the major classes of plan
assets, allowing for the net impact of derivatives on the risk and return profile:
Main scheme All schemes
2010 2009 2008 2010 2009 2008
Quoted equities 7.7% 8.0% 8.4% 7.5% 7.8% 8.4%
Private equity 7.7% 8.0% 8.4% 7.7% 8.0% 8.4%
Index-linked bonds 4.2% 4.5% 3.9% 4.0% 4.5% 3.9%
Government fixed interest bonds —— 3.9% 2.9% 4.0% 4.3%
Corporate and other bonds 5.5% 5.9% 6.1% 5.2% 5.8% 5.7%
Hedge funds 6.0% 6.2% — 5.3% 4.3% 8.4%
Property 6.7% 6.2% 6.1% 6.4% 6.0% 6.1%
Derivatives 0.0% 0.0% 2.5% 0.0% 0.0% 2.5%
Cash and other assets 4.0% 4.2% 2.5% 3.7% 3.8% 5.1%
Equity exposure of equity futures 7.7% 8.0% — 7.7% 8.0% —
Cash exposure of equity futures 4.0% 4.2% — 4.0% 4.2% —
Total fund 6.7% 6.8% 7.1% 6.3% 6.1% 6.3%
Post-retirement mortality assumptions (Main scheme) 2010 2009 2008
Longevity at age 60 for current pensioners (years)
Males 27.2 27.1 26.1
Females 29.6 29.5 26.9
Longevity at age 60 for future pensioners currently aged 40 (years)
Males 29.3 29.2 28.1
Females 30.8 30.8 28.2
293RBS Group 2010
Financial statements