RBS 2010 Annual Report Download - page 290
Download and view the complete annual report
Please find page 290 of the 2010 RBS annual report below. You can navigate through the pages in the report by either clicking on the pages listed below, or by using the keyword search tool below to find specific information within the annual report.-
 1
1 -
2
-
3
-
4
-
5
-
6
-
7
-
8
-
9
-
10
-
11
-
12
-
13
-
14
-
15
-
16
-
17
-
18
-
19
-
20
-
21
-
22
-
23
-
24
-
25
-
26
-
27
-
28
-
29
-
30
-
31
-
32
-
33
-
34
-
35
-
36
-
37
-
38
-
39
-
40
-
41
-
42
-
43
-
44
-
45
-
46
-
47
-
48
-
49
-
50
-
51
-
52
-
53
-
54
-
55
-
56
-
57
-
58
-
59
-
60
-
61
-
62
-
63
-
64
-
65
-
66
-
67
-
68
-
69
-
70
-
71
-
72
-
73
-
74
-
75
-
76
-
77
-
78
-
79
-
80
-
81
-
82
-
83
-
84
-
85
-
86
-
87
-
88
-
89
-
90
-
91
-
92
-
93
-
94
-
95
-
96
-
97
-
98
-
99
-
100
-
101
-
102
-
103
-
104
-
105
-
106
-
107
-
108
-
109
-
110
-
111
-
112
-
113
-
114
-
115
-
116
-
117
-
118
-
119
-
120
-
121
-
122
-
123
-
124
-
125
-
126
-
127
-
128
-
129
-
130
-
131
-
132
-
133
-
134
-
135
-
136
-
137
-
138
-
139
-
140
-
141
-
142
-
143
-
144
-
145
-
146
-
147
-
148
-
149
-
150
-
151
-
152
-
153
-
154
-
155
-
156
-
157
-
158
-
159
-
160
-
161
-
162
-
163
-
164
-
165
-
166
-
167
-
168
-
169
-
170
-
171
-
172
-
173
-
174
-
175
-
176
-
177
-
178
-
179
-
180
-
181
-
182
-
183
-
184
-
185
-
186
-
187
-
188
-
189
-
190
-
191
-
192
-
193
-
194
-
195
-
196
-
197
-
198
-
199
-
200
-
201
-
202
-
203
-
204
-
205
-
206
-
207
-
208
-
209
-
210
-
211
-
212
-
213
-
214
-
215
-
216
-
217
-
218
-
219
-
220
-
221
-
222
-
223
-
224
-
225
-
226
-
227
-
228
-
229
-
230
-
231
-
232
-
233
-
234
-
235
-
236
-
237
-
238
-
239
-
240
-
241
-
242
-
243
-
244
-
245
-
246
-
247
-
248
-
249
-
250
-
251
-
252
-
253
-
254
-
255
-
256
-
257
-
258
-
259
-
260
-
261
-
262
-
263
-
264
-
265
-
266
-
267
-
268
-
269
-
270
-
271
-
272
-
273
-
274
-
275
-
276
-
277
-
278
-
279
-
 280
280 -
 281
281 -
 282
282 -
 283
283 -
 284
284 -
 285
285 -
 286
286 -
 287
287 -
 288
288 -
 289
289 -
 290
290 -
 291
291 -
 292
292 -
 293
293 -
 294
294 -
 295
295 -
 296
296 -
 297
297 -
 298
298 -
 299
299 -
 300
300 -
301
-
302
-
303
-
304
-
305
-
306
-
307
-
308
-
309
-
310
-
311
-
312
-
313
-
314
-
315
-
316
-
317
-
318
-
319
-
320
-
321
-
322
-
323
-
324
-
325
-
326
-
327
-
328
-
329
-
330
-
331
-
332
-
333
-
334
-
335
-
336
-
337
-
338
-
339
-
340
-
341
-
342
-
343
-
344
-
345
-
346
-
347
-
348
-
349
-
350
-
351
-
352
-
353
-
354
-
355
-
356
-
357
-
358
-
359
-
360
-
361
-
362
-
363
-
364
-
365
-
366
-
367
-
368
-
369
-
370
-
371
-
372
-
373
-
374
-
375
-
376
-
377
-
378
-
379
-
380
-
381
-
382
-
383
-
384
-
385
-
386
-
387
-
388
-
389
-
390
-
391
-
392
-
393
-
394
-
395
-
396
-
397
-
398
-
399
-
400
-
401
-
402
-
403
-
404
-
405
-
406
-
407
-
408
-
409
-
410
-
411
-
412
-
413
-
414
-
415
-
416
-
417
-
418
-
419
-
420
-
421
-
422
-
423
-
424
-
425
-
426
-
427
-
428
-
429
-
430
-
431
-
432
-
433
-
434
-
435
-
436
-
437
-
438
-
439
-
440
-
441
-
442
-
443
-
444
-
445
 |
 |

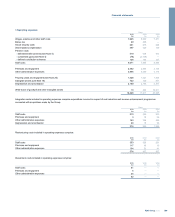
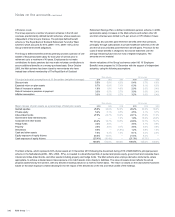
2Non-interest income (excluding insurance net premium income)
Group
2010 2009 2008
£m £m £m
Fees and commissions receivable 8,193 8,738 8,855
Fees and commissions payable
- banking (1,892) (2,351) (2,043)
- insurance related (319) (439) (401)
(2,211) (2,790) (2,444)
Income/(loss) from trading activities (1)
Foreign exchange 1,491 2,340 1,906
Interest rate 1,862 3,883 1,026
Credit 41 (4,147) (12,207)
Other 1,123 1,685 250
4,517 3,761 (9,025)
Gain on redemption of own debt (2) 553 3,790 —
Other operating income (excluding insurance net premium income)
Operating lease and other rental income 1,394 1,323 1,469
Changes in the fair value of own debt attributable to own credit (3) 249 51 977
Changes in the fair value of securities and other financial assets and liabilities (180) 42 (1,266)
Changes in the fair value of investment properties (405) (117) (86)
Profit on sale of securities 496 162 164
Profit on sale of property, plant and equipment 50 40 177
(Loss)/profit on sale of subsidiaries and associates (107) (144) 934
Life business profits/(losses) 90 156 (52)
Dividend income 69 78 276
Share of profits less losses of associated entities 70 (268) 45
Other income (4) (247) (450) (485)
1,479 873 2,153
Notes:
(1) The analysis of trading income/(loss) is based on how the business is organised and the underlying risks managed. Trading income/(loss) comprises gains and losses on financial instruments held
for trading, both realised and unrealised, interest income and dividends and the related funding costs.
The types of instruments include:
-Foreign exchange: spot foreign exchange contracts, currency swaps and options, emerging markets and related hedges and funding.
-Interest rate: interest rate swaps, forward foreign exchange contracts, forward rate agreements, interest rate options, interest rate futures and related hedges and funding.
-Credit: asset-backed securities, corporate bonds, credit derivatives and related hedges and funding.
-Other: equities, commodities, equity derivatives, commodity contracts and related hedges and funding.
(2) In May 2010, the Group redeemed certain subordinated debt securities and equity preference shares in exchange for cash or senior debt. The exchanges involving instruments classified as liabilities
all met the criteria in IFRS for treatment as the extinguishment of the original liability and the recognition of a new financial liability. Gains on these exchanges and on the redemption of securities
classified as liabilities for cash, totalling £553 million were credited to profit or loss. No amounts have been recognised in profit or loss in relation to the redemption of securities classified as equity in
the Group financial statements. The difference between the consideration and the carrying value for these securities amounting to £651 million has been recorded in equity. A similar series of
exchange and tender offers completed in April 2009 and resulted in a gain of £3,790 million being credited to profit or loss and £829 million being recorded in equity.
(3) Measured as the change in fair value from movements in the period in the credit risk premium payable by the Group.
(4) Includes income from activities other than banking and insurance.
RBS Group 2010288
Notes on the accounts continued