RBS 2010 Annual Report Download - page 131
Download and view the complete annual report
Please find page 131 of the 2010 RBS annual report below. You can navigate through the pages in the report by either clicking on the pages listed below, or by using the keyword search tool below to find specific information within the annual report.-
 1
1 -
2
-
3
-
4
-
5
-
6
-
7
-
8
-
9
-
10
-
11
-
12
-
13
-
14
-
15
-
16
-
17
-
18
-
19
-
20
-
21
-
22
-
23
-
24
-
25
-
26
-
27
-
28
-
29
-
30
-
31
-
32
-
33
-
34
-
35
-
36
-
37
-
38
-
39
-
40
-
41
-
42
-
43
-
44
-
45
-
46
-
47
-
48
-
49
-
50
-
51
-
52
-
53
-
54
-
55
-
56
-
57
-
58
-
59
-
60
-
61
-
62
-
63
-
64
-
65
-
66
-
67
-
68
-
69
-
70
-
71
-
72
-
73
-
74
-
75
-
76
-
77
-
78
-
79
-
80
-
81
-
82
-
83
-
84
-
85
-
86
-
87
-
88
-
89
-
90
-
91
-
92
-
93
-
94
-
95
-
96
-
97
-
98
-
99
-
100
-
101
-
102
-
103
-
104
-
105
-
106
-
107
-
108
-
109
-
110
-
111
-
112
-
113
-
114
-
115
-
116
-
117
-
118
-
119
-
120
-
 121
121 -
 122
122 -
 123
123 -
 124
124 -
 125
125 -
 126
126 -
 127
127 -
 128
128 -
 129
129 -
 130
130 -
 131
131 -
 132
132 -
 133
133 -
 134
134 -
 135
135 -
 136
136 -
 137
137 -
 138
138 -
 139
139 -
 140
140 -
 141
141 -
142
-
143
-
144
-
145
-
146
-
147
-
148
-
149
-
150
-
151
-
152
-
153
-
154
-
155
-
156
-
157
-
158
-
159
-
160
-
161
-
162
-
163
-
164
-
165
-
166
-
167
-
168
-
169
-
170
-
171
-
172
-
173
-
174
-
175
-
176
-
177
-
178
-
179
-
180
-
181
-
182
-
183
-
184
-
185
-
186
-
187
-
188
-
189
-
190
-
191
-
192
-
193
-
194
-
195
-
196
-
197
-
198
-
199
-
200
-
201
-
202
-
203
-
204
-
205
-
206
-
207
-
208
-
209
-
210
-
211
-
212
-
213
-
214
-
215
-
216
-
217
-
218
-
219
-
220
-
221
-
222
-
223
-
224
-
225
-
226
-
227
-
228
-
229
-
230
-
231
-
232
-
233
-
234
-
235
-
236
-
237
-
238
-
239
-
240
-
241
-
242
-
243
-
244
-
245
-
246
-
247
-
248
-
249
-
250
-
251
-
252
-
253
-
254
-
255
-
256
-
257
-
258
-
259
-
260
-
261
-
262
-
263
-
264
-
265
-
266
-
267
-
268
-
269
-
270
-
271
-
272
-
273
-
274
-
275
-
276
-
277
-
278
-
279
-
280
-
281
-
282
-
283
-
284
-
285
-
286
-
287
-
288
-
289
-
290
-
291
-
292
-
293
-
294
-
295
-
296
-
297
-
298
-
299
-
300
-
301
-
302
-
303
-
304
-
305
-
306
-
307
-
308
-
309
-
310
-
311
-
312
-
313
-
314
-
315
-
316
-
317
-
318
-
319
-
320
-
321
-
322
-
323
-
324
-
325
-
326
-
327
-
328
-
329
-
330
-
331
-
332
-
333
-
334
-
335
-
336
-
337
-
338
-
339
-
340
-
341
-
342
-
343
-
344
-
345
-
346
-
347
-
348
-
349
-
350
-
351
-
352
-
353
-
354
-
355
-
356
-
357
-
358
-
359
-
360
-
361
-
362
-
363
-
364
-
365
-
366
-
367
-
368
-
369
-
370
-
371
-
372
-
373
-
374
-
375
-
376
-
377
-
378
-
379
-
380
-
381
-
382
-
383
-
384
-
385
-
386
-
387
-
388
-
389
-
390
-
391
-
392
-
393
-
394
-
395
-
396
-
397
-
398
-
399
-
400
-
401
-
402
-
403
-
404
-
405
-
406
-
407
-
408
-
409
-
410
-
411
-
412
-
413
-
414
-
415
-
416
-
417
-
418
-
419
-
420
-
421
-
422
-
423
-
424
-
425
-
426
-
427
-
428
-
429
-
430
-
431
-
432
-
433
-
434
-
435
-
436
-
437
-
438
-
439
-
440
-
441
-
442
-
443
-
444
-
445
 |
 |

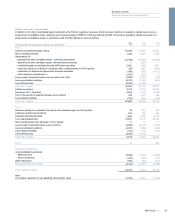
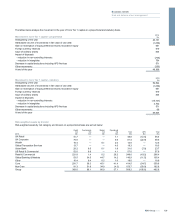
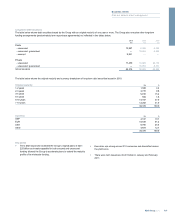
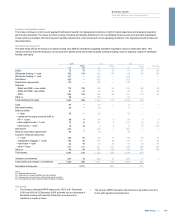
The tables below analyse the movement in the year of Core Tier 1 capital on a proportional and statutory basis.
Movement in Core Tier 1 capital - proportional 2010
£m
At beginning of the year 48,151
Attributable loss net of movements in fair value of own debt (1,250)
Gain on redemption of equity preference shares recorded in equity 651
Foreign currency reserves 610
Issue of ordinary shares 804
Impact of disposals
- reduction in non-controlling interests (729)
- reduction in intangibles 754
Decrease in capital deductions including APS first loss 571
Other movements (253)
At end of the year 49,309
Movement in Core Tier 1 capital - statutory 2010
£m
At beginning of the year 59,524
Attributable loss net of movements in fair value of own debt (1,250)
Gain on redemption of equity preference shares recorded in equity 651
Foreign currency reserves 610
Issue of ordinary shares 804
Impact of disposals
- reduction in non-controlling interests (15,107)
- reduction in intangibles 3,732
Decrease in capital deductions including APS first loss 571
Other movements 69
At end of the year 49,604
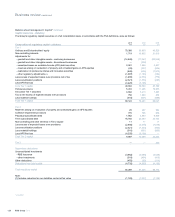
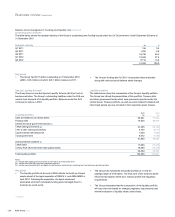
Risk-weighted assets by division
Risk-weighted assets by risk category and division on a proportional basis are set out below:
Credit
risk
Counterparty
risk
Market
risk
Operational
risk Total APS Total
2010 £bn £bn £bn £bn £bn £bn £bn
UK Retail 41.7 — — 7.1 48.8 (12.4) 36.4
UK Corporate 74.8 — — 6.6 81.4 (22.9) 58.5
Wealth 10.4 — 0.1 2.0 12.5 — 12.5
Global Transaction Services 13.7 — — 4.6 18.3 — 18.3
Ulster Bank 29.2 0.5 0.1 1.8 31.6 (7.9) 23.7
US Retail & Commercial 52.0 0.9 — 4.1 57.0 — 57.0
Retail & Commercial 221.8 1.4 0.2 26.2 249.6 (43.2) 206.4
Global Banking & Markets 53.5 34.5 44.7 14.2 146.9 (11.5) 135.4
Other 16.4 0.4 0.2 1.0 18.0 — 18.0
Core 291.7 36.3 45.1 41.4 414.5 (54.7) 359.8
Non-Core 91.3 31.8 34.9 (4.3) 153.7 (50.9) 102.8
Group 383.0 68.1 80.0 37.1 568.2 (105.6) 462.6
129RBS Group 2010
Business review
Risk and balance sheet management